


TL;DR:
- Production downtime includes any period when manufacturing equipment stops generating output, whether planned or unplanned. Reducing downtime requires structured maintenance, dynamic scheduling, real-time monitoring, and Lean Six Sigma methodologies to improve efficiency and prevent costly stoppages.
Production downtime is defined as any period when manufacturing equipment or a production line stops generating output, whether planned or unplanned. For plant managers and production supervisors, the financial stakes are significant. Unplanned breakdowns consume 30–40% of total available production time and cost manufacturers between $39,000 and $1.3 million per hour depending on facility size. Knowing how to reduce production downtime is not a theoretical exercise. It requires structured maintenance, dynamic scheduling, real-time monitoring, and the disciplined application of Lean Six Sigma methodologies working together.
Production downtime divides into two categories: planned and unplanned. Planned downtime covers scheduled maintenance, changeovers, and shift handovers. Unplanned downtime is the costly category, caused by events that were not anticipated and therefore not prepared for.
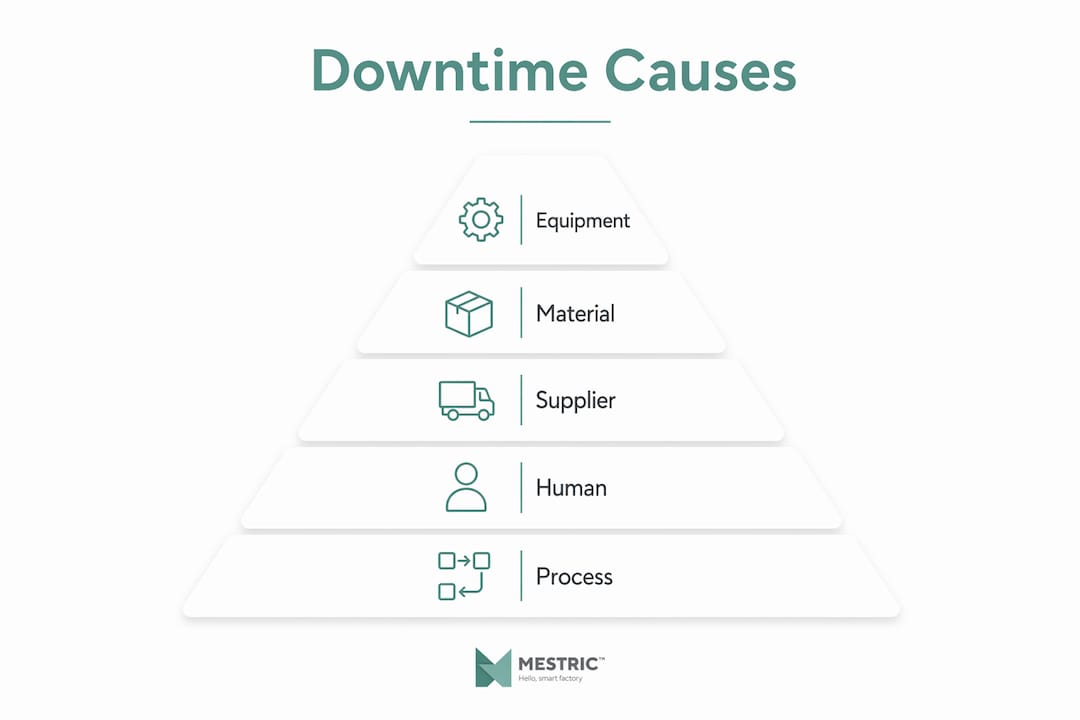
The most common causes of unplanned downtime in manufacturing include:
The table below shows how these causes typically rank by frequency and financial impact:
| Cause | Frequency | Financial impact |
|---|---|---|
| Equipment failure | Very high | Very high |
| Material shortages | Visoko | Visoko |
| Changeover delays | Srednje | Srednje |
| Operator errors | Srednje | Medium to high |
| Scheduling conflicts | Srednje | Srednje |
Supplier performance is a frequently overlooked driver of downtime. Tracking actual vs promised delivery times is critical because manufacturers often build invisible buffers into their schedules to compensate for unreliable suppliers. Those buffers mask the real problem and cause scheduling misalignment that compounds over time.
Preventive maintenance is a scheduled approach where equipment is serviced at fixed intervals regardless of condition. Predictive maintenance goes further by using condition monitoring data to service equipment only when measurements indicate it is needed. Both approaches outperform reactive maintenance, which waits for failure before acting.
The practical benefits of moving from reactive to preventive or predictive maintenance are well established:
Strokovni nasvet: Mark optimal speed, pressure, and temperature settings directly on each machine with a physical label or colour band. Operators then have an instant visual reference and are far less likely to make unnecessary adjustments that cause avoidable stoppages.
Predictive maintenance requires an upfront investment in sensors and data infrastructure, but the return is measurable. Facilities that implement it consistently report a significant reduction in unplanned stoppages. The real-time production monitoring tools available through platforms like Mestric connect directly to equipment and surface this data in a single dashboard, making the shift from reactive to predictive maintenance far more accessible for mid-sized manufacturers.

Material delays are one of the most disruptive causes of downtime because their effects cascade. When one component arrives late, multiple downstream jobs stall, operators stand idle, and the entire production sequence falls out of order. The standard response, which is to manually patch the schedule job by job, creates hidden downtime elsewhere in the line.
Constraint-based scheduling resequences entire production queues dynamically to minimise the impact of material delays and preserve throughput. Rather than adjusting one job at a time, the system recalculates the optimal sequence for all affected jobs simultaneously, accounting for machine capacity, operator availability, and material arrival windows.
A structured approach to dynamic scheduling involves four steps:
The comparison below shows the difference between reactive patching and dynamic rescheduling:
| Approach | Speed of response | Downstream impact | Hidden downtime risk |
|---|---|---|---|
| Reactive patching | Slow, manual | Visoko | Visoko |
| Dynamic rescheduling | Fast, automated | Low | Low |
Tracking supplier delivery compliance must focus on actual receipt dates versus promised dates. Failing to do so builds unseen buffers into the schedule that cause misalignment and delays well before any material physically runs out. You can explore production scheduling frameworks that address these constraints in detail.
Real-time monitoring gives supervisors and operators visibility into what is happening on the line at the moment it happens, not hours later in a shift report. Automated alerts and digital dashboards allow early detection of deviations, which means problems are caught before they become stoppages.
The most effective monitoring programmes combine technology with structured human routines:
Strokovni nasvet: Run a short daily review of the previous shift’s downtime log with the team that caused it, not just the maintenance team. Operators who see their own data and contribute to root cause analysis take far greater ownership of uptime.
Lack of visibility, rather than equipment shortage, is often the largest barrier to operational efficiency in manufacturing. When operators and supervisors cannot see what is happening in real time, they make decisions based on assumptions. Those assumptions introduce delays that accumulate across shifts and weeks.
Lean and Six Sigma provide the structural frameworks that turn one-off improvements into lasting results. Without a systematic approach, gains from maintenance or scheduling improvements tend to erode within months as old habits return.
The key Lean tools relevant to downtime reduction are:
The Six Sigma DMAIC cycle (Define, Measure, Analyse, Improve, Control) provides the analytical backbone. It structures root cause analysis so that corrective actions address the actual cause of downtime rather than its symptoms.
Overall Equipment Effectiveness, or OEE, is the metric that ties these frameworks together. OEE balances availability, performance, and quality to give a single, comprehensive view of how well a machine or line is performing. It is widely regarded as the gold standard metric for manufacturing efficiency because it prevents teams from improving one dimension at the expense of another. You can find a detailed breakdown of OEE and related metrics to support your measurement programme.
Implementing Lean and data-driven methodologies can reduce manufacturing lead times by 37% and increase production capacity by 60%. Those figures represent the upper end of documented results, but even partial gains at that scale represent a significant competitive advantage.
| Lean tool | Primary downtime impact | Measurable outcome |
|---|---|---|
| 5S | Reduces search time and misplacement | 20% reduction in tool search time |
| Poka Yoke | Eliminates operator-induced errors | 80% reduction in assembly errors |
| Value Stream Mapping | Identifies bottlenecks and waste | Reduced lead time |
| OEE tracking | Balances availability, performance, quality | Comprehensive efficiency visibility |
Reducing production downtime requires combining preventive maintenance, dynamic scheduling, real-time monitoring, and Lean methodologies into a single, coordinated programme rather than applying each in isolation.
| Točka | Podrobnosti |
|---|---|
| Unplanned downtime is costly | Breakdowns consume 30–40% of production time and cost up to $1.3 million per hour. |
| Maintenance approach matters | Predictive and preventive maintenance consistently outperform reactive repair strategies. |
| Dynamic scheduling protects throughput | Constraint-based rescheduling minimises the cascade effect of material delays across the line. |
| Operator visibility reduces errors | Real-time dashboards and hourly stand-ups catch deviations before they become stoppages. |
| Lean tools deliver measurable gains | 5S and Poka Yoke produce documented reductions in search time and assembly errors. |
One pattern I have seen repeatedly in manufacturing environments is the instinct to speed up the bottleneck machine when output falls behind. It feels logical. The bottleneck is the constraint, so running it faster should recover lost time. In practice, running bottleneck machines faster without addressing upstream and downstream constraints simply shifts the bottleneck and creates hidden downtime elsewhere. You end up with a faster machine feeding a queue that cannot be processed, or starving a downstream station that now waits.
The second thing most guides understate is the human element. Technology alone does not reduce downtime. I have seen facilities with excellent monitoring systems where operators ignored the dashboards because they had never been involved in interpreting the data. When operators participate in short interval reviews and see their own shift data, the culture shifts. They start flagging problems earlier because they understand the consequences of not doing so.
The third lesson is that scheduling fixes must be systemic, not cosmetic. Patching individual jobs when materials are late feels productive but leaves the underlying sequence in a worse state than before. Dynamic rescheduling that recalculates the full queue is harder to implement but produces results that hold. The qualitative benefit, which is a team that trusts the schedule rather than working around it, is just as valuable as the quantitative throughput gain.
— Andraž
Plant managers who want to move from spreadsheets and reactive firefighting to a structured, data-driven approach need tools that connect directly to their equipment and surface the right information at the right time.

Mestric is a Manufacturing Execution System built for exactly this purpose. It connects to your machinery, tracks OEE, performance, and quality parameters in real time, and gives supervisors the dashboards they need to act before problems escalate. The platform also supports production scheduling and downtime analysis, so you can identify patterns, not just individual incidents. If you are evaluating your options, the MES vs traditional manufacturing comparison is a practical starting point. You can also review the manufacturing efficiency workflow guide to see how MES tools translate into measurable cost reductions.
Production downtime is any period when a machine or production line stops generating output. It includes both planned stoppages, such as scheduled maintenance, and unplanned events such as equipment failure or material shortages.
Unplanned downtime costs manufacturers between $39,000 and $1.3 million per hour depending on facility size and sector. It also consumes 30–40% of total available production time.
Overall Equipment Effectiveness (OEE) is the gold standard metric for manufacturing efficiency. It combines availability, performance, and quality into a single score that prevents teams from improving one dimension at the expense of another.
Preventive maintenance services equipment at fixed intervals regardless of condition. Predictive maintenance uses condition monitoring data to service equipment only when measurements indicate it is required, reducing unnecessary interventions and extending asset life.
Lean tools produce documented, quantified results. 5S reduced time spent searching for tools and materials by 20% in published case studies, while Poka Yoke reduced electrical assembly errors by 80%, both of which directly lower downtime frequency.


 069 763 552