


Manufacturers struggle with productivity losses from fragmented visibility into production workflows. Without real-time data, inefficiencies compound, bottlenecks go undetected, and costs escalate. AI-powered Manufacturing Execution Systems (MES) deliver actionable insights that transform workflow effectiveness, driving measurable cost reductions and operational gains. This guide walks you through prerequisites, implementation steps, AI integration, troubleshooting, and expected results to optimize your manufacturing efficiency workflow.
| Point | Details |
|---|---|
| Real-time visibility | Digital MES platforms enable continuous monitoring, boosting operational effectiveness. |
| AI-driven insights | Analytics identify bottlenecks and predict maintenance, preventing costly downtime. |
| Preparation matters | Proper infrastructure assessment and staff training prevent common implementation failures. |
| Proven ROI | Expect 15% cost reduction and 10-15% OEE improvement within 12 months. |
| Continuous gains | Iterative optimization sustains long-term manufacturing efficiency improvements. |
Before deploying a digital MES, you must establish a solid foundation. Rushing implementation without proper preparation leads to integration headaches, low adoption, and wasted investment. Start by assessing IT infrastructure and machinery connectivity to ensure your network can handle real-time data capture. Legacy systems often lack modern sensor capabilities, requiring retrofits or gateway devices to bridge the gap.
Staff readiness is equally critical. Workers accustomed to manual processes resist change when training is inadequate. Invest time in comprehensive onboarding sessions that demonstrate how MES tools simplify daily tasks rather than complicate them. Change management workshops build buy-in and reduce friction during rollout.
Key preparation steps include:
Pro Tip: Conduct a pilot test on a single production line before full-scale deployment. This approach reveals integration challenges early, allowing you to refine processes and training materials based on real feedback. Small wins build confidence and demonstrate value to skeptical stakeholders.
Once prerequisites are met, follow this structured approach to launch real-time monitoring. Each step builds on the previous, creating a comprehensive system that transforms raw data into actionable workflow improvements.
Map current workflows and select KPIs. Document every production step, noting cycle times, changeover durations, and quality checkpoints. Identify which metrics matter most for your operation: Overall Equipment Effectiveness (OEE), first-pass yield, downtime frequency, or throughput rate. Prioritize three to five KPIs that directly impact profitability.
Integrate MES with equipment and data sources. Connect sensors and controllers to your MES platform using industrial protocols like OPC UA or MQTT. Configure data collection intervals based on process variability. High-speed lines may require second-by-second updates, while batch processes work fine with minute-level granularity.
Create dashboards that visualize KPIs. Design interfaces for different user roles. Operators need simple, color-coded alerts on machine status. Supervisors require shift summaries and trend comparisons. Executives want high-level metrics and exception reports. Following a comprehensive monitoring process guide ensures you cover all stakeholder needs.
Implement data validation procedures. Automated systems generate massive data volumes, but garbage in equals garbage out. Set up validation rules that flag outliers, detect sensor drift, and cross-check calculated metrics against physical constraints. Regular calibration prevents bad data from corrupting analytics.
Run pilot tests and iterate. Start with a controlled environment where you can closely monitor system behavior. Compare MES outputs against manual observations to verify accuracy. Adjust thresholds, refine alert logic, and optimize dashboard layouts based on user feedback. Improvement guides provide frameworks for continuous refinement.
Pro Tip: Schedule daily stand-up meetings during the first month of operation. Brief check-ins help your team quickly resolve technical glitches, share best practices, and maintain momentum through the learning curve.
| Implementation Phase | Timeline | Key Deliverable |
|---|---|---|
| Workflow mapping | 2 weeks | Documented processes with KPI definitions |
| System integration | 4-6 weeks | Live data feeds from all critical equipment |
| Dashboard development | 3 weeks | Role-specific interfaces with real-time updates |
| Pilot testing | 4 weeks | Validated system with trained operators |
| Full deployment | 2-3 weeks | Facility-wide monitoring across all lines |
Real-time data collection sets the stage, but AI analytics unlock transformative improvements. Machine learning algorithms detect patterns invisible to human observers, predicting failures before they occur and recommending process adjustments that boost efficiency. AI integration increases OEE by 10-15% by automating corrective actions and eliminating guesswork.

Deploy predictive maintenance models that analyze vibration, temperature, and performance trends. These systems flag anomalies days or weeks before catastrophic failures, allowing scheduled repairs during planned downtime instead of emergency stops. You avoid rush shipping costs for replacement parts and eliminate production losses from unexpected breakdowns.
AI excels at bottleneck identification. Traditional analysis relies on static reports that show yesterday’s problems. AI continuously monitors every workstation, material queue, and quality gate, pinpointing constraints as they emerge. When a coating station slows due to temperature drift, the system alerts operators immediately and suggests corrective setpoint adjustments.
Key AI applications include:
Integrating these capabilities streamlines manufacturing processes by removing human bottlenecks in decision-making. Operators receive clear, data-backed recommendations rather than ambiguous instructions. Quality improves, waste drops, and throughput climbs without adding headcount.
Even well-planned MES projects encounter obstacles. Recognizing common pitfalls early prevents costly delays and keeps your optimization initiative on track. Inadequate staff training causes 40% of MES implementation failures, making education your top priority.
Avoid over-customizing your MES during initial deployment. Every custom feature adds complexity, extends timelines, and creates maintenance burdens. Start with out-of-the-box functionality, then add tailored elements after your team masters core capabilities. Premature customization generates confusion and reduces adoption rates.
Data integration issues plague many projects. Legacy equipment uses proprietary protocols that resist modern connectivity standards. Budget for middleware or gateway devices that translate between old and new systems. Test integration points thoroughly before going live, simulating edge cases like network interruptions and sensor failures.
Common challenges and solutions:
Pro Tip: Assign a dedicated MES champion on each shift. This person becomes the go-to resource for questions, gathers user feedback, and reinforces best practices. Peer support accelerates proficiency faster than formal training alone.
Quantifying MES impact validates your investment and guides ongoing optimization. Track key performance indicators monthly, comparing pre-implementation baselines against post-deployment results. Manufacturers achieve 15% operational cost reduction within 12 months when MES drives data-informed decisions.
Overall Equipment Effectiveness (OEE) serves as the primary efficiency metric. AI-driven analytics typically deliver 10-15% OEE improvements by reducing downtime, accelerating cycle times, and improving first-pass quality. Monitor each OEE component separately: availability gains come from predictive maintenance, performance gains from bottleneck elimination, and quality gains from tighter process control.
Downtime reductions materialize quickly. Expect unplanned stops to drop 20% within six months as predictive alerts prevent failures and faster troubleshooting resolves issues. Real-time monitoring cuts manual data errors by 80%, eliminating transcription mistakes and calculation errors that plague paper-based systems.
Labor efficiency improves as workers spend less time on data collection and more on value-added tasks. Automated reporting frees supervisors from spreadsheet drudgery, allowing focus on coaching and continuous improvement. Following remote monitoring software results shows similar productivity patterns across industries.
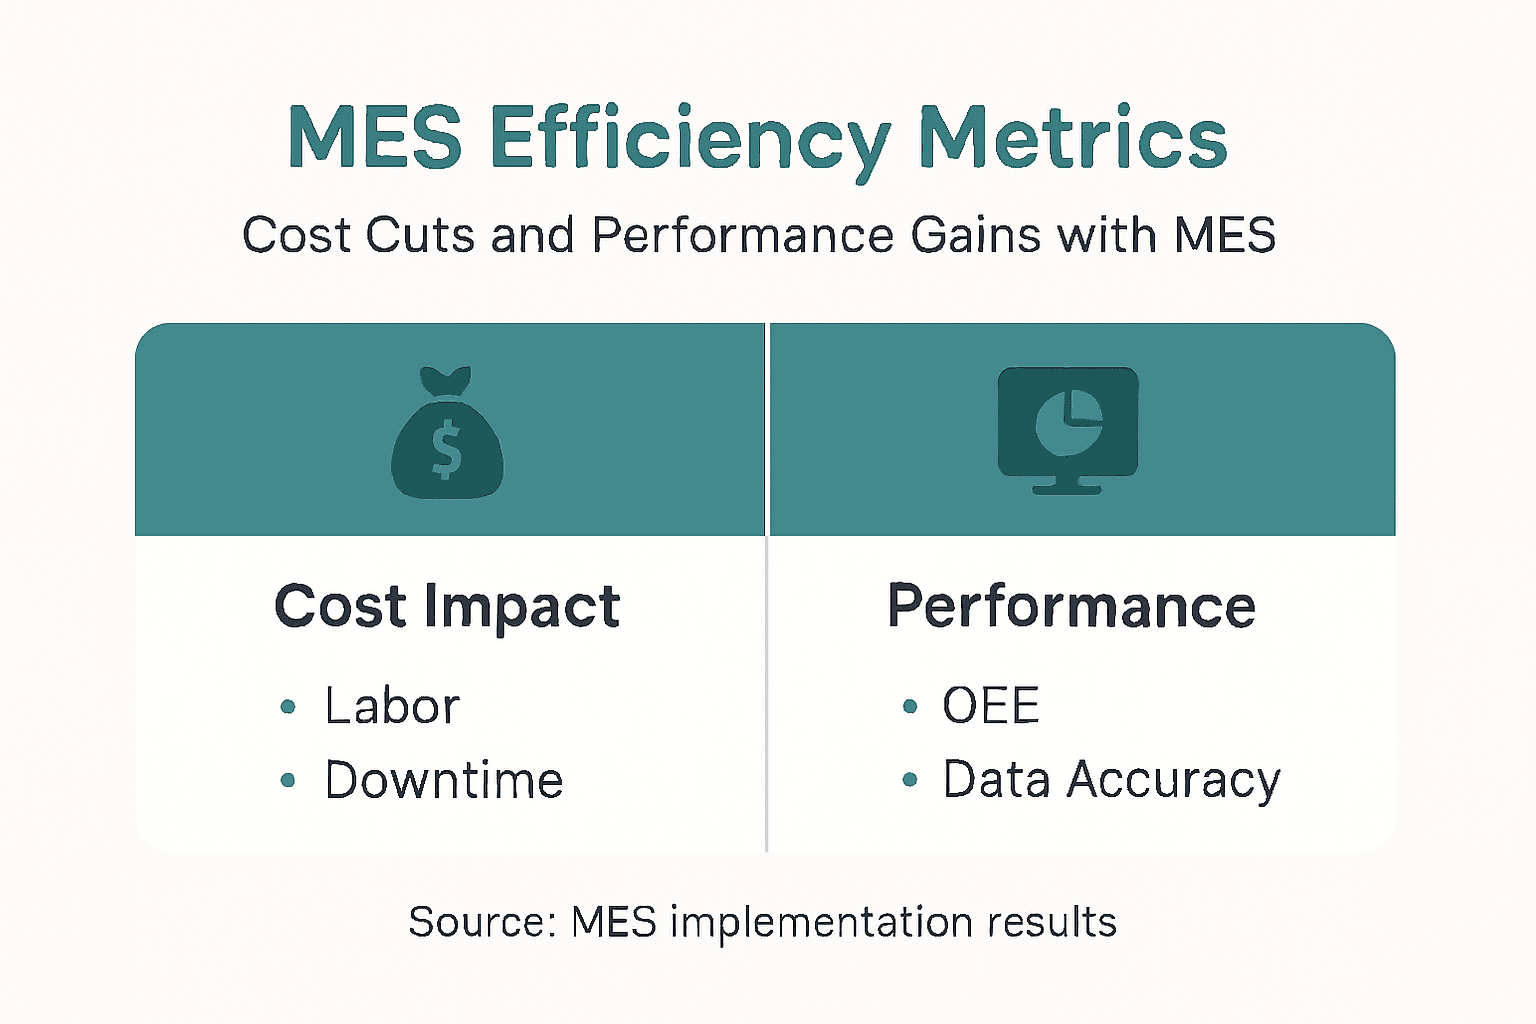
| Approach | Cost Reduction | OEE Gain | Downtime Impact | Data Accuracy |
|---|---|---|---|---|
| Traditional manual tracking | Baseline | Baseline | Baseline | 60-70% |
| Basic digital MES | 5-8% | 3-5% | 10% reduction | 85-90% |
| AI-powered MES | 12-15% | 10-15% | 20% reduction | 95-98% |
You’ve seen how real-time MES and AI analytics drive measurable efficiency gains. Now consider how Mestric™ delivers these benefits tailored to your unique production environment. This AI-integrated platform connects directly with your equipment, capturing live performance data and transforming it into actionable insights.
Mestric™ automates bottleneck identification, predicts maintenance needs, and recommends process improvements that reduce costs and boost quality. Manufacturers using our system report the same 15% cost reductions and OEE improvements detailed in this guide. Explore how MES tools improve manufacturing efficiency through our comprehensive platform designed for rapid deployment and intuitive use. Discover real-time production monitoring capabilities that turn data into competitive advantage. Visit our site to schedule a personalized demonstration and see how Mestric™ transforms your workflow optimization from concept to reality.
Overall Equipment Effectiveness (OEE) combines availability, performance, and quality into one comprehensive metric. Track cycle time, changeover duration, first-pass yield, and unplanned downtime as supporting indicators. Focus on three to five KPIs that directly impact your profit margins rather than monitoring dozens of marginal metrics.
Pilot deployments on a single line typically show measurable improvements within 4-6 weeks. Full facility rollouts require 3-4 months from planning to complete deployment. Expect to see initial downtime reductions and quality gains within the first quarter, with full cost savings materializing over 12 months.
Yes, through retrofit sensors and protocol converters that bridge legacy machinery to modern platforms. Most equipment built after 2000 supports standard industrial communication protocols. Older machines may need add-on sensors for vibration, temperature, or cycle counting. Gateway devices translate proprietary formats into MES-compatible data streams.
Operators need 8-12 hours of hands-on training covering dashboard navigation, alert interpretation, and basic troubleshooting. Supervisors require an additional 16 hours on reporting, analytics, and configuration. Maintenance teams benefit from specialized sessions on predictive alerts and data-driven diagnostics. Ongoing refresher training every six months reinforces best practices.
Start by verifying network connectivity and firewall rules that may block data transmission. Check sensor calibration and sampling rates to ensure readings fall within expected ranges. Use diagnostic tools to monitor data packet flow from equipment to MES platform. Isolate integration points one at a time, testing each connection independently before combining data streams.


