


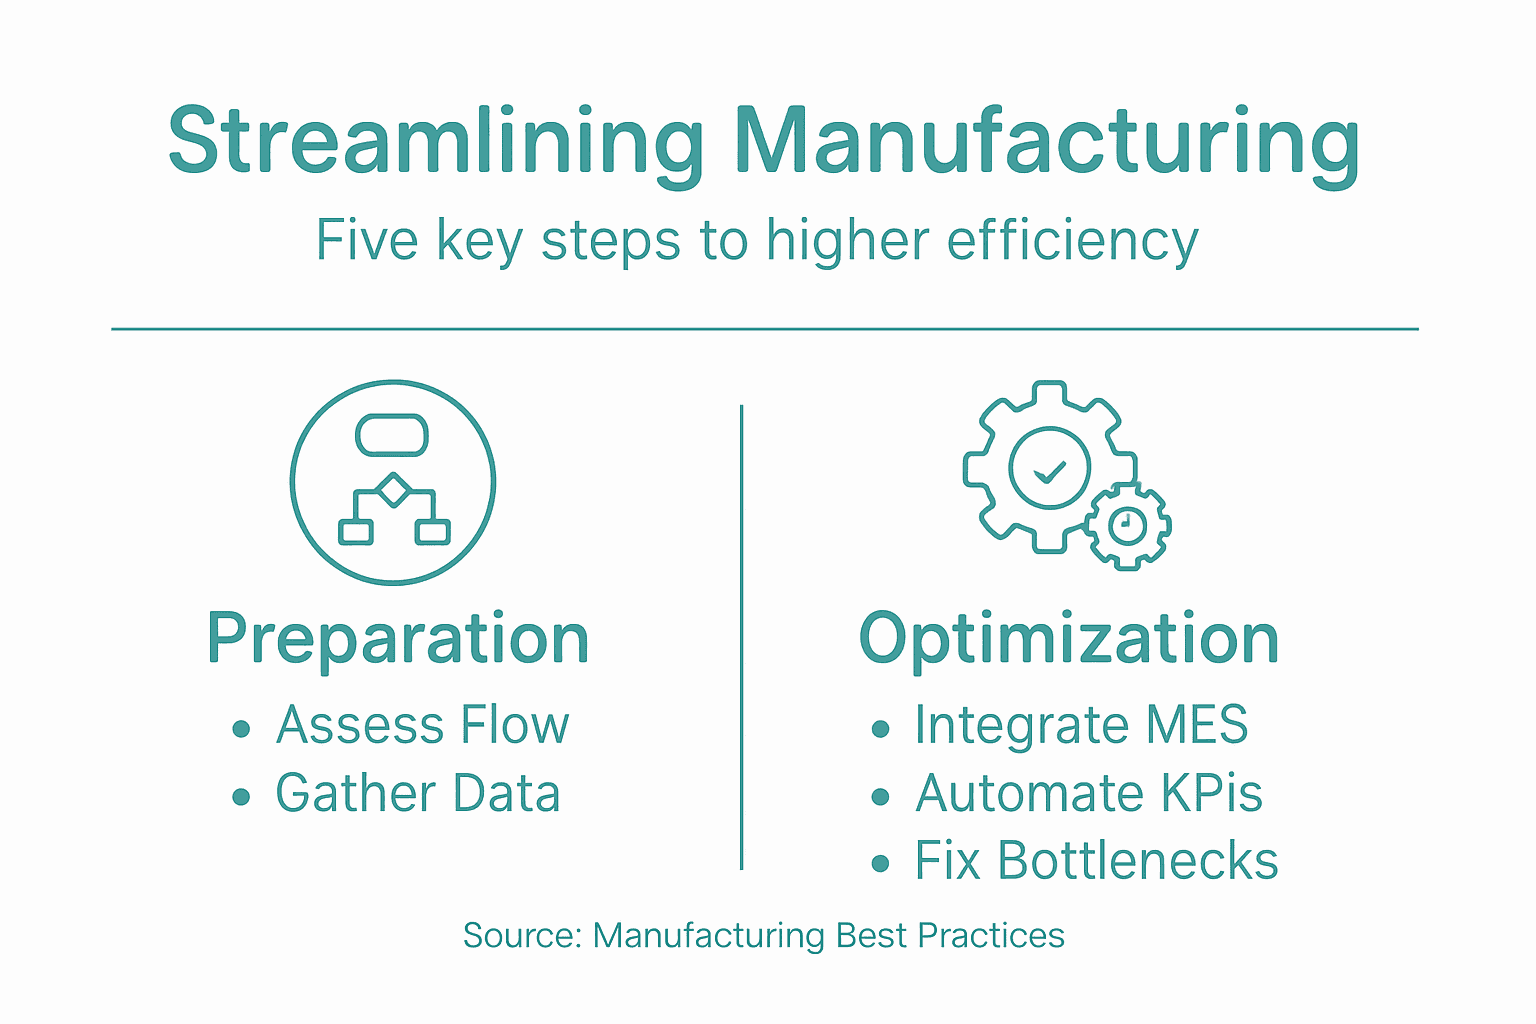
Every European manufacturing plant manager faces mounting pressure to cut costs whilst keeping operations efficient. Without a clear view of day-to-day production data, blind spots threaten progress and profits. Building a foundation with accurate process mapping and adopting real-time production data collection helps reveal where resources are wasted and where digital change brings the most value. This guide shows how assessing your workflows and integrating digital tools enables real, measurable improvements on the shop floor.
| Key Point | Explanation |
|---|---|
| 1. Assess current workflows thoroughly | Document each production stage, including machine and labour details, to understand efficiency and identify key performance indicators (KPIs). |
| 2. Utilise automated data collection | Integrate Manufacturing Execution System (MES) with equipment for real-time data access, improving accuracy and visibility over manual methods. |
| 3. Monitor and respond to KPIs in real time | Define essential KPIs and establish alert thresholds to quickly address deviations, ensuring continuous operational improvements. |
| 4. Identify and resolve bottlenecks | Use KPI data to locate production slowdowns and implement targeted changes to improve efficiency at constrained points. |
| 5. Verify improvements with performance analytics | Track KPIs after changes to assess effectiveness, share results with your team, and learn from successes or shortcomings. |
Before you can improve your manufacturing operations, you need a clear picture of what’s happening on your production floor right now. This step involves documenting your current processes and gathering the data that reveals how efficiently everything actually runs.
Start by mapping your production workflows from start to finish. Walk through each stage of your manufacturing process and note down what happens at each point. Document the machines involved, the people working at each station, how long each step takes, and where materials move between processes.
Whilst walking through, identify your key performance indicators (KPIs) that matter most. Common manufacturing metrics include:
Here is a summary of common manufacturing KPIs and how they influence business objectives:
| KPI Name | What It Measures | Business Impact |
|---|---|---|
| Overall Equipment Effectiveness (OEE) | Equipment utilisation and productivity | Highlights capacity and performance losses |
| Production Cycle Time | Time to complete one production cycle | Directly affects throughput and delivery |
| Defect Rate | Ratio of non-conforming units produced | Impacts quality costs and customer trust |
| Machine Downtime | Amount and reasons for stoppages | Reveals maintenance and reliability issues |
| Labour Productivity | Output per worker or station | Drives operational efficiency |
| Cost Per Unit | Average cost to produce each item | Guides pricing and profit improvement |
Next, gather actual data from your operations. Check whether you’re currently collecting this information manually or through connected equipment. Many plants still rely on spreadsheets, shift reports, or memory. Others have partial data from older systems that don’t communicate with each other.
This table compares manual versus automated production data collection methods:
| Aspect | Manual Collection | Automated (MES) Collection |
|---|---|---|
| Speed | Slow, often delayed | Instant, real-time data |
| Error Rate | High, reliant on humans | Low, machine-logged accuracy |
| Data Consistency | Varies by operator | Consistent across equipment |
| Visibility | Limited to past data | Immediate process insight |
| Scalability | Difficult for large plants | Simple across many machines |
| Decision Support | Reactive, lagging info | Proactive, data-driven action |
Here’s where real-time production data becomes invaluable. Understanding how data flows through your operation reveals gaps in your visibility and shows which processes you can’t currently measure. Review your manufacturing benchmarks against industry standards to see where you stand. Manufacturing key benchmarks from established organisations provide median values for selected KPIs across your sector.
Analyse your current data quality. Is your information accurate? How often is it recorded? Are there delays between when something happens and when you know about it? Poor data quality leads to poor decisions.
Your baseline assessment becomes the foundation for all future improvements. Without knowing where you are now, you cannot measure progress or identify what actually works.
Document any bottlenecks you observe. These are the points where production slows down, queues form, or materials wait. Bottlenecks often reveal themselves through experienced operators, shift supervisors, or visible delays on the floor.
Pro tip: Interview your production team directly before analysing data. Your floor supervisors and machine operators know exactly where problems occur, why they happen, and what’s already been tried. Their insights will guide your assessment and help you prioritise which workflows to examine first.
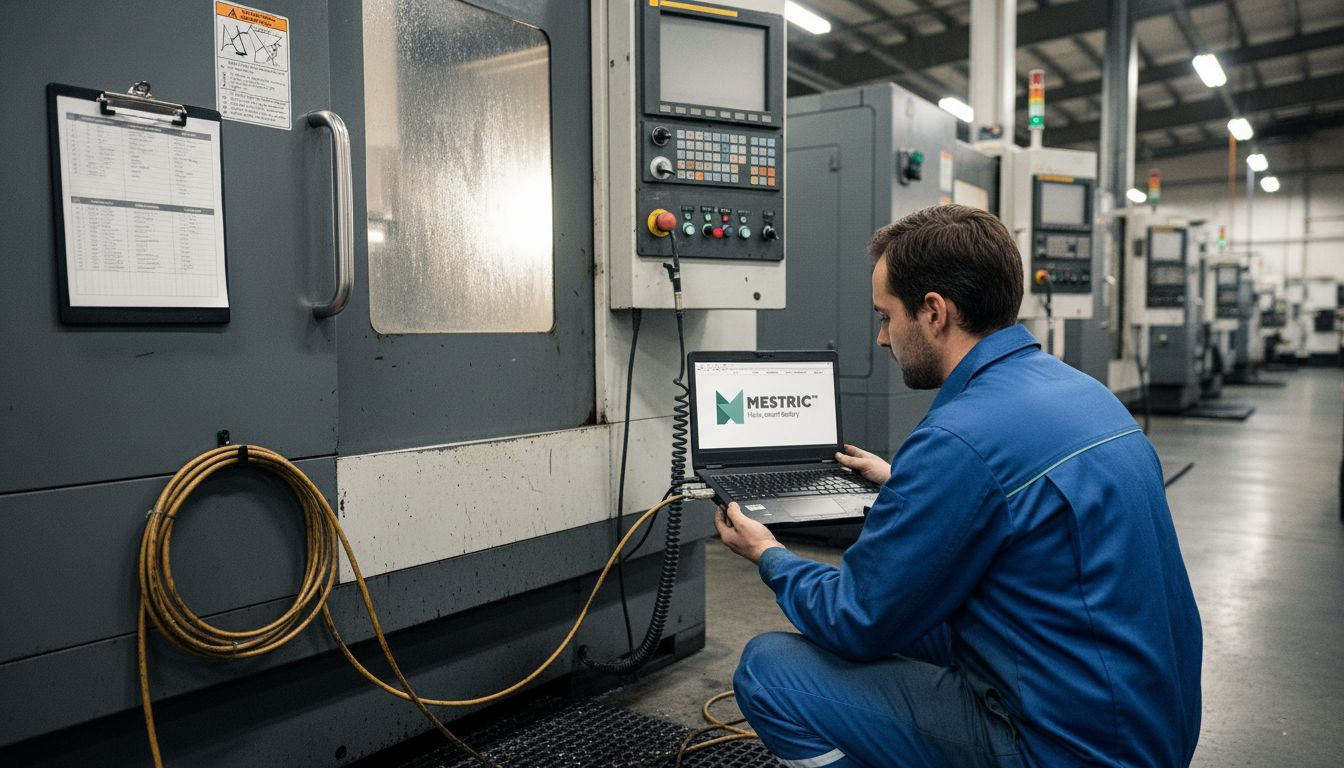
Now that you understand your current operations, it’s time to connect your equipment to a Manufacturing Execution System (MES). This integration bridges the gap between your shop floor machines and your data, enabling real-time visibility into production.
Start by identifying which equipment on your production floor can communicate with digital systems. Modern machines often have built-in connectivity features, whilst older equipment may need adapters or industrial gateways. Check your machinery documentation or consult with your equipment suppliers about available communication protocols such as OPC-UA, Modbus, or Ethernet.
Your MES needs to collect data from multiple sources across your production line. The right MES architecture enables information exchange between your equipment and central system, creating transparency in your manufacturing processes.
Plan your integration approach in these stages:
Consider data security during integration. Connected equipment creates new entry points into your manufacturing network, so ensure your MES includes proper access controls, encryption, and user authentication.
The integration also needs to align with your broader manufacturing strategy. Smart manufacturing connectivity requires not just equipment links, but also integration with your analytics, scheduling, and quality systems.
Build in flexibility for future expansion. Your MES should handle new equipment additions, different data formats, and evolving business requirements without major reconfiguration.
Equipment integration is not a one-time event. Plan for ongoing updates, new sensor types, and improved data collection methods as your operations mature.
Work closely with your MES provider during this phase. They understand compatibility challenges and can recommend the best approach for your specific equipment mix and facility layout.
Pro tip: Start your integration with your most consistent, predictable production line rather than your most complex one. Success on this line gives you valuable experience and proven processes before tackling more complicated equipment and workflows.
With your equipment connected, you can now set up automated monitoring that tracks your key performance indicators in real time. This transforms how quickly you detect problems and make decisions on your production floor.
Start by defining which KPIs matter most for your operation. These should directly link to your business goals, whether that’s reducing costs, improving quality, or increasing throughput. Common KPIs include overall equipment effectiveness (OEE), cycle times, defect rates, machine availability, and labour productivity.
Real-time process monitoring using advanced data analytics enables you to detect anomalies as they happen rather than discovering them hours or days later in shift reports.
Set performance targets for each KPI. Establish what “normal” looks like for your operation, then define alert thresholds that trigger notifications when something deviates. Your targets should be realistic but aspirational, pushing for continuous improvement without being impossible to achieve.
Configure your monitoring system to collect and display data automatically:
Use manufacturing KPI standards to ensure your definitions are consistent with industry practices and comparable across facilities if you operate multiple plants.
Create visual dashboards that show your KPIs at a glance. Your production managers should see instantly whether production is on track, where bottlenecks exist, and which machines need attention. Different roles need different views: operators focus on their station, supervisors see entire lines, and plant managers see factory-wide performance.
Automated monitoring only works if people actually look at the data and act on it. Build a routine of reviewing KPIs daily and responding to alerts quickly.
Set up automatic alerts for critical issues. When a machine exceeds downtime thresholds or quality metrics fall below targets, notifications should reach the right person immediately so they can respond before problems escalate.
Pro tip: Start tracking just five to seven KPIs rather than trying to monitor everything at once. Once your team gets comfortable with these core metrics and develops response routines, you can gradually expand to additional indicators.
Your real-time data now reveals where production slows down. Bottlenecks are the constraints that limit your overall throughput, and identifying them is the key to unlocking significant efficiency gains across your entire operation.
Start by examining your KPI data to find where production consistently falls behind schedule. Look for stations where materials pile up, where cycle times are longest, or where machines spend the most time idle waiting for upstream work. These visual clues point directly to your bottlenecks.
Analyse the root causes behind each bottleneck. Is a machine running slowly because it needs maintenance? Does a particular operator struggle with a complex task? Are materials arriving late from suppliers? Dynamic bottleneck prediction requires understanding the interdependencies between your manufacturing resources, not just identifying which station is slowest.
Use data to prioritise which bottlenecks to tackle first. Focus on constraints that affect your most profitable product lines or create the biggest delays. A bottleneck affecting 5% of your output deserves less attention than one affecting 40%.
Consider several resolution strategies:
Implement changes systematically. Test one solution at a time so you can measure the actual impact of each change. Watch your KPIs closely during the trial period to confirm improvements.
Bottlenecks move. Once you resolve one constraint, another may emerge as your next limitation. Some bottlenecks are temporary, caused by specific orders or seasonal demand. Others are structural and require permanent changes.
Real bottlenecks rarely stay fixed without ongoing attention. Build a culture where your team continuously monitors for new constraints and proposes improvements.
Document what you learn from each bottleneck resolution. Share successful solutions across your facility or other plants so you benefit from this knowledge repeatedly.
Pro tip: Never assume your biggest bottleneck is where you think it is. Use data to verify. Sometimes the apparent problem is just a symptom of a constraint elsewhere in your production line that creates a ripple effect.
You’ve made changes to your processes. Now comes the crucial part: proving they actually work. Performance analytics transforms raw data into clear evidence of improvement, showing you exactly what’s working and where to focus next.
Start by establishing a baseline measurement before changes took effect. Your earlier KPI assessment gives you the before picture. Document those baseline numbers precisely so you have a fair comparison point.
After implementing improvements, track the same KPIs over a meaningful time period. Most changes need at least two to four weeks to show reliable patterns, since temporary fluctuations can mask real progress. Avoid judging results after just a few days of data.
Compare your new performance against your baseline using clear metrics:
Visual KPI analytics transform operational data into patterns you can see immediately, making improvements obvious to your entire team rather than buried in spreadsheets.
Calculate the financial impact of your improvements. If you reduced downtime by 10%, what’s that worth in recovered production? If defects fell by 15%, what savings appear in your quality costs? Translating performance gains into money makes the value concrete.
Share results with your team transparently. When operators see that their efforts improved overall equipment effectiveness by 8% or reduced cycle times by 12%, they understand the real impact of process changes.
Verification isn’t about proving you were right. It’s about learning what actually works so you can repeat successes and avoid repeating mistakes.
If improvements fell short of targets, investigate why. Sometimes external factors intervene. Other times, your change wasn’t as effective as expected. Either way, the data tells you whether to adjust the approach, try a different solution, or accept partial gains.
Use successful improvements as case studies. Document what changed, what worked, and why. These become templates for tackling similar problems elsewhere in your facility.
Pro tip: Always measure at least two weeks of post-change data before declaring victory. Early wins often fade as teams revert to old habits or external conditions change. Real improvements stick because they become embedded in how work actually happens.
You have explored how assessing workflows, integrating equipment, and automating KPI monitoring are vital steps to streamline manufacturing processes effectively. Yet, challenges like limited real-time visibility, complex equipment integration, and persistent bottlenecks can hold back progress and impact operational efficiency. Mestric™ directly addresses these critical pain points by offering an easy-to-use Manufacturing Execution System that connects seamlessly with your machinery, providing instant performance tracking, quality monitoring, and data-driven insights needed to optimise every stage of your production.
Take control of your manufacturing efficiency today. Discover how Mestric™ empowers production managers to identify inefficiencies early, accelerate bottleneck resolution, and validate improvements with clear analytics. Don’t wait until delays and quality issues affect your bottom line. Visit Mestric™ real-time production data and start transforming your processes with actionable insights. Ready to see how Mestric™ can modernise your manufacturing? Request a demonstration now at Mestric™ and experience operational excellence in action.
To assess your manufacturing workflows, map out your processes from start to finish, documenting each stage, the machines used, and the time taken at each point. Walk the production floor and directly observe operations to identify key performance indicators (KPIs) like overall equipment effectiveness and defect rates.
Start by identifying which equipment on your production floor can connect to digital systems, then configure communication protocols for data collection. This should include testing a small group of machines before expanding to your entire production line to ensure reliability in data capture.
To automate monitoring, define the key performance indicators that align with your business goals, such as cycle times and defect rates. Then, set up a system to collect and display this data in real time, establishing alert thresholds for any deviations that require immediate attention.
Examine your KPI data to pinpoint where production slows down, then analyse the root causes of these bottlenecks. Implement changes systematically, such as redistributing work or increasing capacity at constrained stations, and measure the impact of each solution to confirm improvements.
Establish a baseline measurement before implementing changes and track the same KPIs over a meaningful time period afterward. Compare your new performance data to the baseline, focusing on key metrics like overall equipment effectiveness, to determine the effectiveness of your changes.


