


TL;DR:
- Most manufacturers focus on basic production metrics, which reveal what happened but not why or what will happen next. Implementing advanced KPIs like leading indicators, OEE, and SPC enables proactive decision-making and process control for better manufacturing performance. A structured KPI framework, combined with automation and clear definitions, accelerates culture change and enhances operational efficiency.
Most manufacturers track the obvious numbers: units produced, scrap rate, downtime hours. Those figures tell you what happened. They rarely tell you why, and they almost never tell you what is about to happen. Getting advanced manufacturing metrics explained properly means moving beyond surface-level reporting to a structured measurement framework that drives proactive decisions. This article covers the practical fundamentals of leading and lagging KPIs, Overall Equipment Effectiveness (OEE), Statistical Process Control (SPC), and structured KPI frameworks. You will leave with a clear picture of what to measure, how to interpret it, and how to use it.
| Točka | Podrobnosti |
|---|---|
| Lead with leading KPIs | Combine predictive indicators with historical data to shift from reactive to proactive operations. |
| OEE is three metrics in one | Availability, performance, and quality must all be measured accurately or your OEE score is meaningless. |
| SPC prevents defects at source | Control charts detect process instability before defects reach inspection, saving time and material. |
| Standards guide KPI selection | ISO 22400 defines 34 manufacturing KPIs, giving you a proven framework to structure your measurement system. |
| Phase your KPI deployment | Start with foundational throughput metrics, then add efficiency and quality layers as data maturity grows. |
Understanding the difference between leading and lagging KPIs is the foundation of any advanced measurement system. Most teams have plenty of the latter and too few of the former.
Lagging KPIs measure what has already occurred. They are historical, reactive, and useful for understanding outcomes. Common examples in manufacturing include:
These numbers confirm performance trends. They do not prevent the next failure.
Leading KPIs are predictive. They measure conditions or behaviours that correlate with future outcomes. Lagging KPIs measure historical events like downtime and MTTR, while leading indicators such as preventive maintenance (PM) compliance rate and condition-monitoring alerts give you the opportunity to act before a failure occurs. For example, a drop in PM compliance rate this week predicts a rise in unplanned downtime next week. That is a decision point. Lagging KPIs rarely offer one.
The practical benefit is significant. Condition monitoring sensors and PM compliance rates help predict and prevent breakdowns, shifting maintenance culture from firefighting to planning. This is where essential manufacturing metrics start to create genuine competitive advantage.

KPI maturity tends to follow a four-stage progression. Reactive organisations measure downtime after it happens. Proactive ones add leading indicators and set thresholds for intervention. Predictive operations use sensor data and historical patterns to forecast failures. Prescriptive systems go further, automatically recommending or scheduling corrective actions. Most manufacturers sit between stages one and two. Moving to stage three requires technology tools like CMMS and sensors that automate data collection and feed real-time dashboards.
Strokovni nasvet: Map each leading KPI directly to an operational decision. PM compliance rate should trigger a scheduled maintenance review at a defined threshold, not a monthly conversation. If a leading KPI does not connect to a clear action, it is reporting, not managing.
Overall Equipment Effectiveness is the most widely used advanced metric in manufacturing. It quantifies how effectively a piece of equipment is being used relative to its full potential. The formula is straightforward: OEE equals availability × performance × quality.
Each component captures a distinct category of loss:
Multiply those three figures: 87.5% × 80% × 95% = 66.5% OEE. A score of 85% is widely regarded as a world-class benchmark in discrete manufacturing. Scores between 65% and 85% are typical. An OEE below 60% indicates serious efficiency problems and points toward foundational issues in reliability and preventive maintenance rather than fine-tuning.
| OEE range | Interpretation | Priority action |
|---|---|---|
| Below 60% | Serious inefficiency | Address reliability and unplanned downtime |
| 60–75% | Below average | Investigate speed losses and change-over times |
| 75–85% | Acceptable | Focus on quality and minor stoppages |
| Above 85% | World class | Sustain performance and target micro losses |
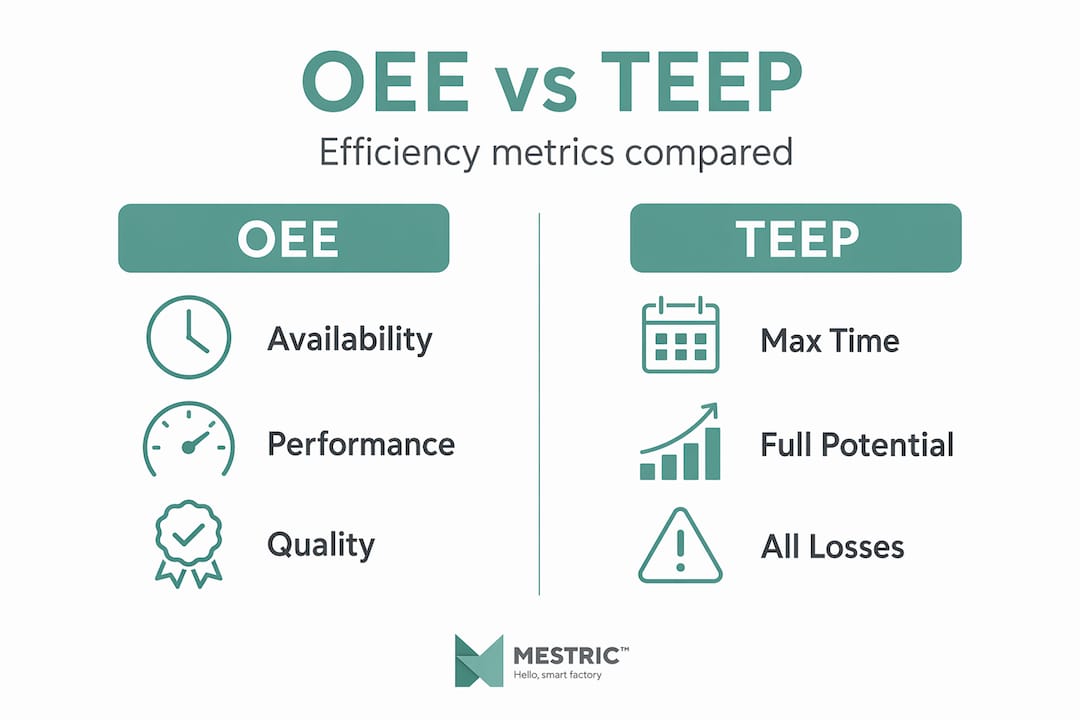
OEE has a close relative worth knowing: Total Effective Equipment Performance (TEEP). TEEP measures effectiveness against calendar time, including all scheduled and unscheduled downtime. OEE benchmarks against planned production time only. TEEP is more demanding and most useful when evaluating capital utilisation strategy rather than day-to-day operational performance.
Strokovni nasvet: Never let operators or supervisors manually calculate OEE on a spreadsheet at the end of a shift. By that point, the data has been summarised, rounded, and occasionally adjusted. Automated, real-time data capture from equipment is the only way to get OEE figures you can trust.
Statistical Process Control (SPC) is a method for monitoring and controlling a process using statistical methods to detect variation. Its power lies in what it does before inspection. Where inspection finds defects, SPC prevents them.
A control chart is the primary SPC tool. It plots a quality characteristic over time against three reference lines: the Centre Line (CL, the process average), the Upper Control Limit (UCL), and the Lower Control Limit (LCL). These limits are set at ±3 standard deviations from the mean based on observed process data. When data points fall within the limits and show no non-random patterns, the process is described as “in control.” When a point falls outside the limits or a non-random pattern appears, the control chart signals special-cause variation requiring investigation and corrective action.
The distinction between variation types matters enormously in practice:
| Variation type | Cause | Management response |
|---|---|---|
| Common cause | Natural process noise, inherent in the system | Improve the process design; operator action will not help |
| Special cause | Identifiable external event, tool wear, material change, operator error | Investigate and eliminate the specific cause immediately |
Misidentifying one type as the other wastes time and makes processes worse. Reacting to common cause variation as if it were special cause creates additional instability.
Implementing SPC correctly requires discipline in the set-up phase. Collect 20 to 25 subgroups under stable conditions before calculating control limits. Train operators to read the charts, not just record numbers. Define exactly what happens when an out-of-control signal appears. Without that response protocol, the chart becomes wallpaper.
You also need to consider the scheduling environment. Manufacturing scheduling disruptions such as rushed set-ups, operator fatigue, and skipped inspections directly undermine SPC effectiveness. Finite capacity scheduling with realistic set-up times protects the stable process conditions SPC depends on.
Different chart types suit different data. X-bar and R charts work well for continuous measurements from subgroups. P-charts handle proportion-defective data. C-charts and U-charts track defect counts per unit. Selecting the right chart type for your process data is as important as drawing the limits correctly.
Strokovni nasvet: SPC’s value multiplies when connected to a workflow that mandates operator response to out-of-control signals. Document the response procedure on the chart itself, not in a separate manual nobody reads during a production run.
Selecting individual KPIs without a governing framework produces a fragmented measurement system. You end up with metrics that nobody owns, data nobody trusts, and dashboards nobody acts on. The real differentiator in advanced KPI systems is governance over KPI definitions and data quality, established before any dashboard is built.
ISO 22400 defines 34 KPIs across production, maintenance, quality, inventory, and people categories. Using this standard as a reference gives your KPI portfolio a consistent structure and enables meaningful benchmarking across sites or business units.
Here is a practical cross-functional view of manufacturing KPIs organised by operational area:
| Area | Example KPIs |
|---|---|
| Production | Throughput rate, schedule attainment, cycle time |
| Maintenance | OEE, MTBF, PM compliance rate, unplanned downtime |
| Quality | First pass yield, defect rate per million, customer return rate |
| Inventory | Raw material days on hand, finished goods turnover, inventory accuracy |
| People | Labour efficiency ratio, absenteeism rate, training completion rate |
A phased deployment approach produces better results than trying to measure everything at once. Start with basic throughput metrics, build data reliability at that level, then layer in efficiency and quality metrics as your team develops the processes and tools to collect them accurately. Trying to measure 34 KPIs from day one creates data quality problems across all of them.
Auditing your existing KPI set is worth doing before adding anything new. Ask three questions for each metric currently in use:
Any metric that fails those three tests should be paused or retired. KPI portfolios bloat over time. Maintaining a lean, well-governed set of key metrics in manufacturing is more valuable than tracking everything poorly.
I have seen teams spend months building dashboards before they have resolved what a “downtime event” actually means across their three production lines. One line counts a five-minute stoppage. Another only logs events over fifteen minutes. The OEE figures are incomparable, and nobody realises it until a cross-site review triggers the obvious question.
In my experience, the organisations that get the most value from advanced manufacturing KPIs do one thing others skip. They write down their KPI definitions before configuring any software. What counts as planned downtime? When does a quality hold event start and stop? These definitions sound administrative. They are actually what separates a meaningful number from a meaningless one.
I have also found that the shift toward balanced leading and lagging KPIs changes maintenance culture faster than any training programme. When a team has a PM compliance rate on their daily board alongside MTTR, the conversation changes from “why did that machine fail?” to “are we on track to prevent the next one?” That shift takes a few months, but it sticks.
The same logic applies to SPC. I have watched SPC charts sit unused on a production floor because nobody defined what to do when a signal appeared. The chart was technically correct and practically worthless. Linking the out-of-control signal to a specific response, assigned to a specific role, is what makes SPC a control method rather than a reporting exercise.
My advice: start with three or four well-defined metrics you can act on daily, make sure the data is clean, and build from there. A phased, disciplined approach always outperforms a complete overhaul that collapses under its own weight.
— Andraž
Understanding the theory behind advanced manufacturing metrics is only part of the challenge. Collecting accurate, real-time data and turning it into decisions at scale requires the right infrastructure.

Mestric is a Manufacturing Execution System designed precisely for this. It connects directly to your production equipment, capturing the data points that feed OEE calculations, SPC charts, and leading KPI dashboards without manual data entry. Production managers can monitor availability, performance, and quality in real time, with AI-powered tools that identify where efficiency losses are occurring and why. If you are looking to move from reactive to real-time tracking, Mestric provides the platform to do it. For those evaluating whether a modern MES is the right next step, the MES vs traditional manufacturing comparison is a practical starting point. Contact Mestric to arrange an onsite demonstration and see how connected equipment data transforms your KPI programme.
Advanced manufacturing KPIs go beyond basic output counts to include predictive leading indicators, statistical quality measures, and multi-component metrics like OEE. They are structured to enable proactive decisions, not just historical reporting.
OEE is calculated by multiplying availability, performance, and quality. For example, 90% availability × 80% performance × 95% quality equals 68.4% OEE, with 85% widely considered a world-class benchmark.
Lagging KPIs report past outcomes such as MTTR and scrap rate, while leading KPIs such as PM compliance rate predict future performance and allow intervention before problems occur.
SPC uses control charts with statistically derived upper and lower limits to distinguish normal process variation from special-cause events that require investigation. It is a method for controlling quality at the point of production rather than after inspection.
ISO 22400 defines 34 structured manufacturing KPIs, but most operations benefit from starting with a smaller, well-governed set and phasing in additional metrics as data reliability improves across each operational area.


 069 763 552