

Real-time monitoring can reduce machine downtime by up to 30%, transforming how factories utilise machines, labour, and materials. Yet many plant managers still operate with delayed data and guesswork, leaving efficiency gains on the table. This guide shows you how digital transformation through Manufacturing Execution Systems (MES) and AI-driven analytics delivers actionable insights that optimise resource utilisation, cut costs, and boost productivity in 2026.
| Point | Details |
|---|---|
| Resource utilisation definition | Efficient deployment of machines, labour, and materials measured through KPIs like OEE and throughput. |
| Digital transformation enables monitoring | MES platforms provide real-time data access, connecting equipment and operators for continuous visibility. |
| Real-time data cuts downtime | Monitoring systems reduce machine downtime by up to 30%, directly improving equipment operational time. |
| Misconceptions block progress | Beliefs like “more machine hours equal better utilisation” ignore quality, setup, and maintenance factors. |
| Practical frameworks drive results | Combining continuous monitoring, root cause analysis, and AI optimisation creates sustained efficiency improvements. |
Resource utilisation measures how effectively you deploy machines, labour, and materials to produce outputs. For plant managers, this means tracking whether equipment runs at capacity, operators work efficiently, and raw materials convert to finished goods with minimal waste.
Resource utilisation is measured through KPIs such as Overall Equipment Effectiveness (OEE), throughput, and downtime percentage revealing interrelated efficiency. OEE combines availability, performance, and quality into a single metric showing true productive time. Throughput measures units produced per shift, whilst downtime percentage quantifies lost production time from breakdowns, changeovers, or material shortages.
Each KPI illuminates different aspects. OEE reveals whether machines operate when scheduled and produce quality outputs at target speeds. Throughput shows if workflows move products efficiently through production stages. Downtime percentage highlights reliability issues requiring maintenance or process improvements.
| KPI | What it measures | Why it matters |
|---|---|---|
| Overall Equipment Effectiveness (OEE) | Availability × Performance × Quality | Comprehensive view of true productive capacity |
| Throughput | Units produced per time period | Workflow efficiency and bottleneck identification |
| Downtime percentage | Non-productive time vs total scheduled time | Equipment reliability and maintenance needs |
| Scrap rate | Defective units vs total production | Material waste and quality process effectiveness |
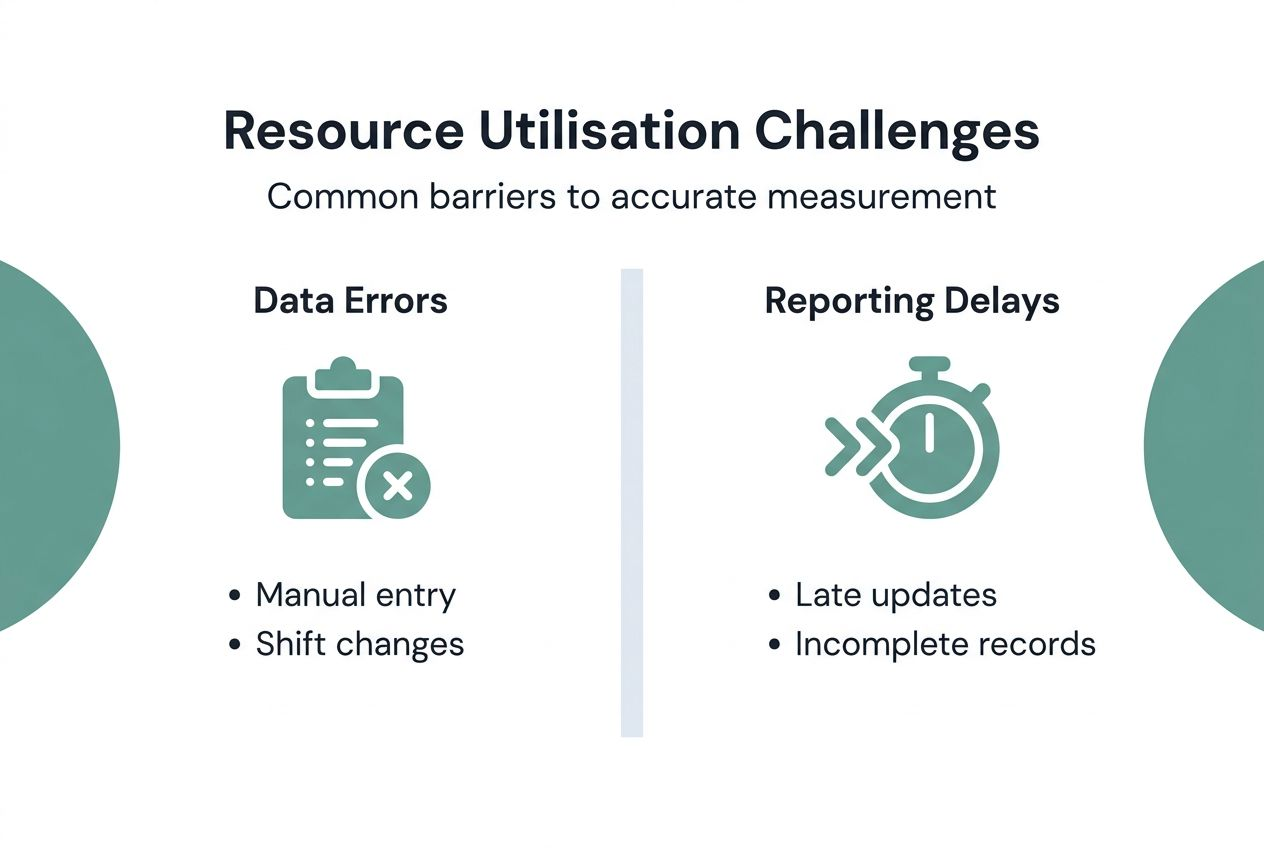
Common measurement challenges include inconsistent data collection across shifts, manual recording errors, and delayed reporting that prevents timely responses. Many factories track only equipment metrics whilst ignoring labour efficiency or material flow constraints.
Pro Tip: Track operational efficiency metrics holistically across machines, people, and materials rather than focusing solely on equipment uptime to identify true bottlenecks.
A complete picture requires balancing all three resource types. High machine utilisation means little if operators wait for materials or quality issues create rework loops.
Digital transformation integrates technology throughout manufacturing operations to capture, analyse, and act on production data instantly. Manufacturing Execution Systems (MES) connect directly with machinery sensors and operator interfaces, creating a continuous data stream from the shop floor.

MES systems integrated with factory machinery and operators enable actionable real-time insights, with AI optimising resource use. These platforms collect cycle times, quality measurements, downtime causes, and operator activities automatically, eliminating manual logs and spreadsheets.
AI algorithms analyse patterns across this data to predict maintenance needs before breakdowns occur, suggest optimal production sequences, and identify process variations affecting quality. Machine learning models improve recommendations over time as they process more production cycles.
Core components of effective digital transformation include:
Digital tools enable data-driven decision-making by replacing gut feelings with quantified evidence. Instead of guessing which machine causes delays, you see actual cycle time distributions. Rather than estimating material waste, you track precise scrap quantities by product and shift.
Pro Tip: When selecting MES integration and AI optimisation solutions, prioritise platforms compatible with mixed equipment environments including legacy machinery to avoid costly infrastructure replacements.
Successful adoption requires training operators and managers to interpret data and act on insights. Technology alone changes nothing without people understanding how to use information for better decisions.
Real-time monitoring transforms reactive management into proactive optimisation. Instead of discovering problems hours later through shift reports, you see issues as they develop and intervene immediately.
Real-time performance monitoring reduces machine downtime by up to 30% directly improving resource utilisation by maximising equipment operational time. When sensors detect abnormal vibrations or temperature spikes, maintenance teams receive instant alerts preventing catastrophic failures that cause extended outages.
Response times to disruptions improve dramatically. Traditional approaches require operators to notice problems, log details, notify supervisors, and wait for corrective action. Digital systems detect anomalies within seconds and route alerts to responsible personnel automatically, cutting response times by 25% or more.
Balanced visibility across labour and machines reduces idle time. If a machine completes a batch early whilst the operator handles another task, the system notifies them to begin the next cycle rather than letting equipment sit unused. Material tracking prevents stockouts that halt production lines.
Real-time monitoring delivering up to 30% downtime reduction represents significant capacity gains without capital investment in additional equipment.
Efficiency gains from continuous monitoring include:
Consider a packaging line where wrapping material frequently jams. Traditional logs show “wrapping issues” but lack specificity. Real-time monitoring advantages include capturing exact temperatures, speeds, and material tension when jams occur, revealing that problems cluster during morning startups when equipment hasn’t reached optimal temperature. Adjusting warmup procedures eliminates most jams.
Another scenario involves assembly stations with varying cycle times. Real-time data shows which stations consistently lag, allowing targeted process improvements rather than blanket initiatives that waste resources on already-efficient areas.
Several myths prevent plant managers from optimising resource use effectively. Understanding these misconceptions helps you avoid counterproductive strategies.
Myth 1: More machine hours automatically mean higher utilisation. Contrary to belief, simply increasing machine hours doesn’t guarantee better utilisation; it requires balancing setup, maintenance, and quality duties. Running equipment longer without considering changeover efficiency or preventive maintenance needs often increases breakdowns and quality defects, ultimately reducing productive output.
Myth 2: MES systems automatically optimise operations once installed. Whilst MES platforms provide powerful capabilities, they require customisation to your specific processes, equipment configurations, and production goals. Default settings rarely match your operational context, and benefits emerge only after tailoring dashboards, alerts, and analytics to your needs.
Myth 3: Resource utilisation focuses exclusively on equipment. Machines represent just one resource type. Ignoring labour efficiency and material flow creates bottlenecks that constrain overall throughput regardless of equipment performance.
Effective resource utilisation balances equipment uptime, labour productivity, and material flow rather than maximising any single factor in isolation.
These misconceptions persist because they oversimplify complex systems. Plant managers face pressure to improve efficiency quickly, making simple solutions like “run machines more” attractive despite limited effectiveness. Manufacturing data misconceptions often stem from incomplete visibility into how different factors interact.
Dispelling myths requires examining actual data showing relationships between variables. You might discover that reducing machine hours through better preventive maintenance scheduling actually increases productive output by eliminating unexpected breakdowns during critical production runs.
Systematic frameworks help translate monitoring data into continuous improvement. Rather than reacting to individual issues, structured approaches identify patterns and address root causes.
Combining continuous real-time monitoring with root cause analysis and AI optimisation creates a holistic model driving sustained resource efficiency. This framework integrates three core elements working together synergistically.
Continuous monitoring provides the foundation:
Root cause analysis digs beneath symptoms. When throughput drops on Tuesday afternoons, surface observation shows the problem but not why it happens. Analysing correlations across machine settings, material batches, operator assignments, and environmental conditions reveals that a specific material supplier’s batches require different tension settings.
AI-driven decision support accelerates improvement cycles. Machine learning models process thousands of variables simultaneously, spotting patterns humans miss. Predictive algorithms forecast maintenance needs, optimisation engines suggest production sequences minimising changeovers, and anomaly detection flags unusual conditions warranting investigation.
| Traditional approach | MES-enabled optimisation |
|---|---|
| Reactive problem-solving after issues occur | Proactive prevention through predictive insights |
| Manual data collection prone to errors | Automated capture ensuring accuracy and completeness |
| Periodic reviews missing real-time opportunities | Continuous monitoring enabling immediate intervention |
| Isolated analysis of individual metrics | Integrated view revealing cross-factor relationships |
| Experience-based decisions | Data-driven choices backed by quantified evidence |
Pro Tip: Prioritise addressing issues with the greatest resource impact first using Pareto analysis to identify the 20% of problems causing 80% of losses rather than spreading efforts thinly across minor concerns.
Implementing these frameworks requires cultural change alongside technology. Staff must trust data over intuition and embrace transparency about performance gaps. Training programmes should cover both technical tool use and analytical thinking skills for interpreting insights.
Establish regular review cycles where teams examine trends, discuss findings, and commit to specific improvement actions. Practical resource utilisation frameworks work best when they become embedded routines rather than sporadic initiatives. Check the manufacturing optimisation checklist for comprehensive implementation guidance.
Real-world implementations validate the impact of digital tools on resource utilisation. One automotive components manufacturer reduced scrap rates by 20% within eight months of deploying MES with integrated quality monitoring. The system automatically flagged parts exceeding dimensional tolerances, allowing immediate machine adjustments preventing entire batch rejections.
Another case involved a food processing plant achieving 15% improvement in equipment utilisation over one year. Real-time monitoring revealed that cleaning cycles consumed far more time than necessary due to inconsistent procedures across shifts. Standardising protocols based on data showing optimal sequences cut changeover time by 35 minutes per cycle.
Challenges emerged in poorly integrated deployments. One electronics assembly facility installed MES but failed to connect all production stations, creating data gaps that prevented comprehensive analysis. Partial visibility proved worse than none because managers made decisions assuming complete information when critical blind spots remained.
Key results from successful implementations include:
Lessons learned emphasise customisation importance. Generic MES configurations miss industry-specific nuances. Food manufacturers need batch traceability features irrelevant to discrete part makers. Pharmaceutical plants require validation capabilities unnecessary in other sectors.
Staff training determines success as much as technology selection. One machinery manufacturer invested heavily in advanced analytics but saw minimal improvement because operators didn’t understand how to interpret dashboards or what actions data suggested. After comprehensive training programmes, the same technology delivered substantial gains.
Starting with pilot projects in specific production areas allows refinement before full-scale rollout. Testing on one line reveals integration challenges, user interface issues, and process adjustments needed without disrupting entire operations.
Successful implementation follows structured phases moving from assessment through deployment to continuous improvement. Rushing adoption without proper planning wastes resources and frustrates users.
Assess current KPIs and data collection methods to identify gaps between available information and decision-making needs. Document which metrics you track manually, what remains unmeasured, and where delays prevent timely responses.
Choose customised MES platforms matching your specific equipment types, production processes, and integration requirements. Evaluate vendors based on compatibility with existing machinery, scalability as operations grow, and support quality during implementation.
Train staff thoroughly on both technical tool operation and analytical interpretation of insights. Include operators who collect data, supervisors who act on alerts, and managers who use trends for strategic decisions.
Establish clear processes defining how teams respond to different alert types and who holds responsibility for each action. Without defined workflows, even excellent data fails to drive improvements.
Execute phased rollout beginning with pilot areas, gathering feedback, refining configurations, then expanding gradually across facilities.
Evaluating existing data gaps requires honest assessment of current capabilities. Many plants overestimate what they know because informal tribal knowledge masks measurement weaknesses. Systematically listing decisions you make and information supporting them reveals reliance on assumptions rather than facts.
Operational context matters when selecting platforms. High-mix low-volume operations need different capabilities than continuous process manufacturing. Consider whether you require advanced scheduling, quality management integration, maintenance coordination, or inventory tracking as primary features.
Pro Tip: Implement monitoring in phases starting with highest-impact areas to demonstrate value quickly, build momentum, and incorporate user feedback before full deployment.
Change management determines whether staff embrace or resist new systems. Involving operators early in planning, addressing concerns transparently, and celebrating wins builds buy-in. Emphasise how tools make their jobs easier rather than positioning technology as oversight mechanisms.
Vendor support quality varies dramatically. Prioritise suppliers offering comprehensive training, responsive technical assistance, and regular software updates. Integration testing before go-live prevents surprises when connecting MES to equipment controllers, enterprise systems, and external data sources.
Follow the step-by-step MES implementation guide for detailed deployment planning and execution support.
Transforming resource utilisation requires tools designed specifically for manufacturing environments. Mestric offers comprehensive digital solutions connecting machinery, operators, and processes into unified visibility platforms that drive measurable efficiency improvements.
Explore the manufacturing software types available to identify which capabilities match your optimisation priorities. Whether you need real-time monitoring, quality tracking, or predictive analytics, understanding software categories helps focus technology investments.
Mestric’s MES tools for manufacturing efficiency deliver the automated data collection, AI-driven insights, and integrated dashboards discussed throughout this guide. The platform connects seamlessly with diverse equipment types whilst providing intuitive interfaces that accelerate user adoption.
Ready to streamline manufacturing processes and capture efficiency gains? Mestric’s solutions support the frameworks and practical approaches proven to enhance resource utilisation across machines, labour, and materials.
Focus on Overall Equipment Effectiveness (OEE) combining availability, performance, and quality for comprehensive equipment assessment. Track throughput measuring units per shift, downtime percentage quantifying lost production time, and scrap rates revealing material waste. These metrics together identify bottlenecks and improvement opportunities across machines, labour, and materials.
AI analyses real-time data streams to predict maintenance needs before breakdowns occur, preventing unplanned downtime. Machine learning algorithms recommend optimal production sequences minimising changeovers and suggest resource allocations maximising throughput. Predictive insights enable proactive decisions rather than reactive problem-solving, reducing waste whilst accelerating response accuracy.
Ignoring labour data whilst focusing exclusively on equipment metrics creates incomplete visibility that misses critical bottlenecks. Deploying generic configurations without customising to your specific processes and production goals limits effectiveness. Insufficient staff training prevents users from interpreting insights or knowing which actions data suggests, wasting technology investments.
Yes, real-time monitoring cuts machine downtime by up to 30% through immediate problem detection and faster response coordination. Reduced downtime directly lowers operational costs by maximising productive hours from existing equipment capacity. Improved throughput, decreased waste, and optimised resource allocation compound savings across labour, materials, and energy consumption.


