

TL;DR:
- Production bottlenecks are often hidden behind overworked machinery, queues, and employee workarounds that become standard.
- Identifying these constraints with accurate data and workflow mapping enables proactive improvement rather than reactive firefighting.
Production bottlenecks are rarely obvious. They hide behind overworked machines, mounting queues, and staff workarounds that have quietly become standard practice. Knowing how to identify production bottlenecks is the difference between reactive firefighting and genuinely improving throughput. Left undetected, bottlenecks drive up costs, delay deliveries, and erode margins faster than most operations managers realise. This guide gives you a structured, practical approach to finding them. From data collection and workflow mapping to AI-powered monitoring and root cause analysis, you will leave with the tools to diagnose your production floor accurately.
| Point | Details |
|---|---|
| Start with the right data | Collect cycle times, queue depths, and equipment availability before drawing any conclusions. |
| Map before you analyse | Value stream mapping exposes where inventory accumulates and cycle times spike. |
| Distinguish symptoms from causes | A slow machine is often a symptom. Use the Five Whys to find the real issue. |
| Real-time monitoring changes the game | AI analytics detect bottleneck migration that static time studies will always miss. |
| Employee insight is irreplaceable | Frontline workers often know about undocumented workarounds that reveal hidden constraints. |
Good production bottleneck analysis depends entirely on the quality of your inputs. Rushing straight to observation without structured data leads to guesswork dressed up as diagnosis.
The core data sources you need are:
Beyond raw data, observational methods matter enormously. A Gemba walk (the practice of going to the actual place where work happens) lets you see queues building, operators waiting, and informal workarounds in action. Structured employee feedback sessions add another layer. Workers often use undocumented workarounds that reveal dynamic bottleneck conditions that no dashboard will surface automatically.
Technology tools range from basic to sophisticated. Here is how traditional data sources compare to AI-powered platforms:
| Data source / tool | Strengths | Limitations |
|---|---|---|
| Manual time studies | Low cost, no infrastructure needed | Snapshots only; misses shift-to-shift variation |
| SCADA systems | Real-time machine data, reliable uptime tracking | Limited process context; rarely tracks WIP queues |
| MES platforms | End-to-end production visibility, KPI dashboards | Requires implementation investment and data quality |
| AI analytics platforms | Continuous constraint scoring, bottleneck migration alerts | Requires clean, time-stamped historical data to train models |
The accuracy of any analysis depends on data that is time-stamped and consistent. A log that shows a machine went down without recording when it came back online is only half the picture. Before you map or analyse, verify your data integrity first.
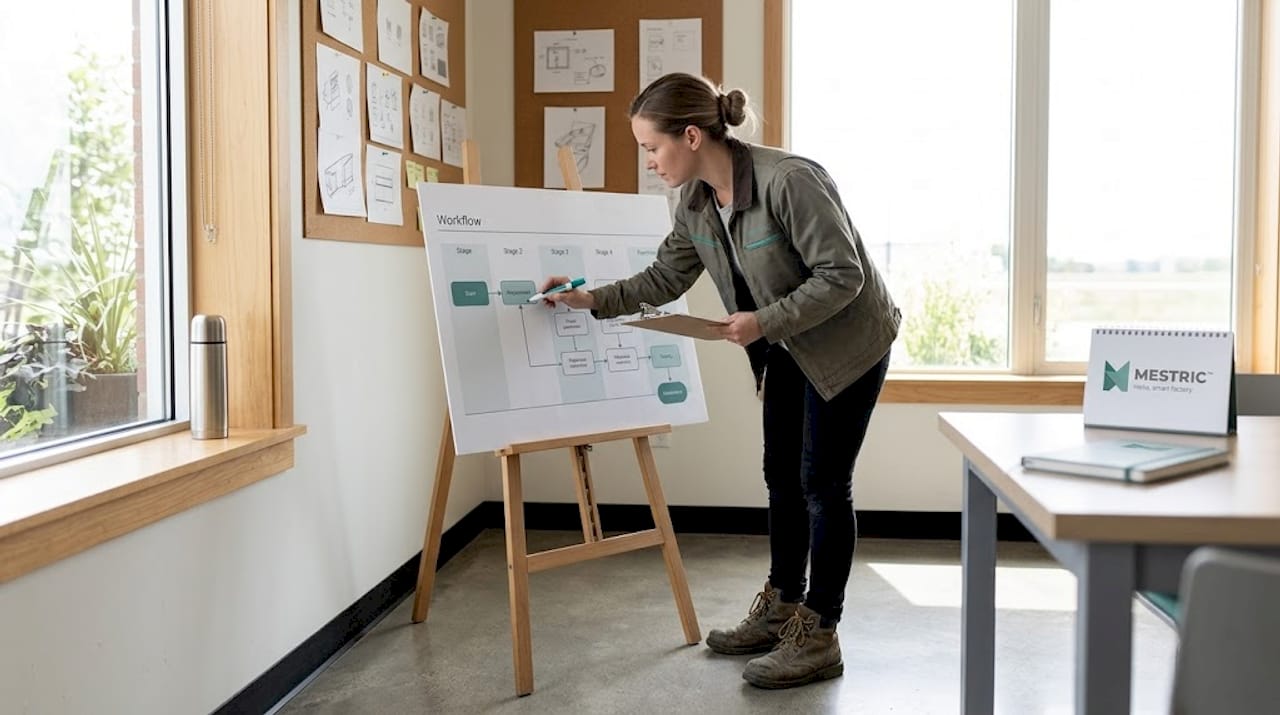
Workflow mapping is the practical backbone of identifying production issues. It turns abstract data into a visual picture of where time and materials actually go.
Follow these steps to build a useful value stream map:
High cycle times and workstation queue lengths are the two most reliable numerical signals pointing to a bottleneck. When you see both at the same station, you have strong evidence to investigate further.
The metrics worth collecting during mapping include takt time (the rate at which products must be completed to meet demand), operator utilisation, and machine occupancy. Comparing these against actual output per shift shows you where the gaps are.
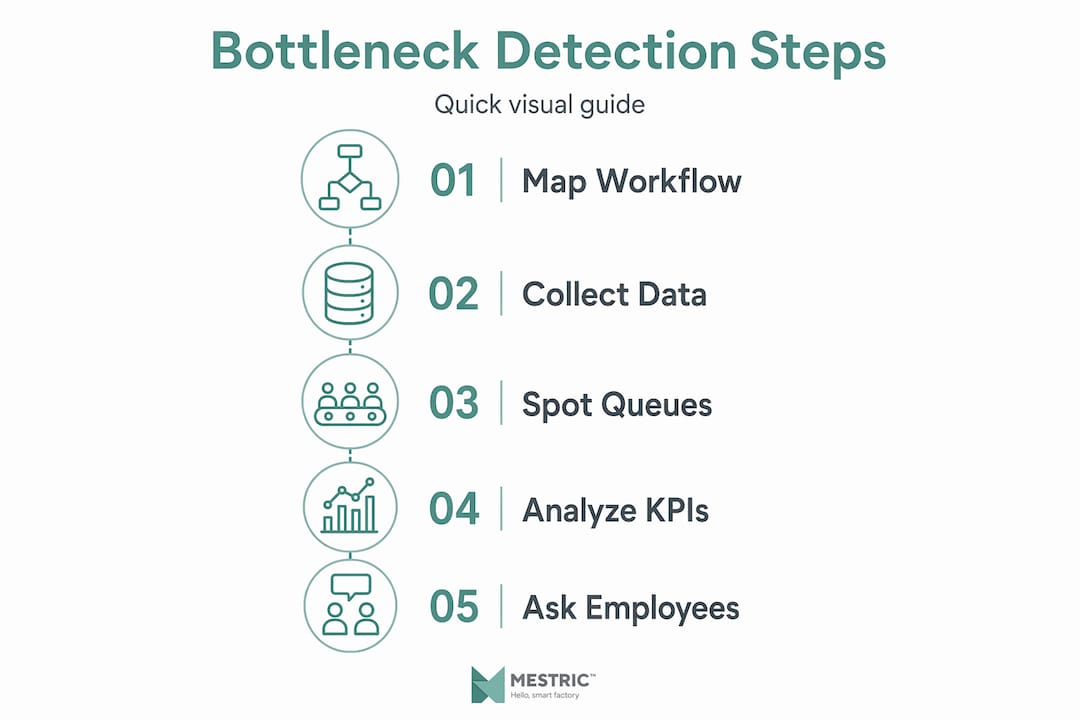
Combining your map with direct employee feedback significantly improves accuracy. Operators on the floor will frequently point you to constraints that the numbers alone obscure.
Pro Tip: Photograph the floor during your mapping exercise. Visual evidence of queue build-up at specific stations gives you concrete proof when presenting findings to senior management, and it prevents the common tendency to smooth over problems in the post-walkthrough discussion.
This is where most bottleneck investigations stall. You find a slow machine. You fix the slow machine. The bottleneck moves. Nothing actually improves.
A symptom is not the root cause. Persistent questioning is required to trace back to the issue you can actually solve. The Five Whys technique is the most practical tool for this.
Here is how it works in a manufacturing context:
You have just moved from a workstation queue to a supply chain quality gap. Fixing Station 7’s speed would have achieved nothing lasting.
“Build a factual timeline from raw evidence before you begin interpreting. Memory is not a reliable source during incident investigation.” Root cause analysis works best when it is grounded in logs, metrics, and timestamps rather than recollection.
Contributing factors are conditions that worsen a bottleneck without being the root cause. A poorly maintained machine may be a contributing factor if the underlying cause is a scheduling practice that prevents proper maintenance windows. Document both clearly, as mixing them leads to incomplete fixes.
Pro Tip: Create a simple evidence log during your investigation: date, data source, finding, and proposed action. This prevents analysis drift and gives you a clear audit trail when you review whether your fix actually worked.
Traditional time studies give you a photograph. AI analytics give you a live feed. The difference matters because bottlenecks migrate under different product mixes, demand levels, and shift conditions.
Here is what AI-driven monitoring does that manual methods cannot:
The practical requirement for this approach is clean, time-stamped data. An AI model trained on inconsistent or incomplete logs will generate unreliable constraint scores. Before deploying AI monitoring, audit your data pipeline and close any gaps in your logging.
The real-time production monitoring capability within platforms like Mestric connects directly to equipment and surfaces KPIs including downtime, queue lengths, and performance against takt time, giving you the data quality that AI analytics require.
| Monitoring method | Bottleneck migration detection | Data requirement | Update frequency |
|---|---|---|---|
| Manual time study | None | Low | Weekly or monthly |
| SCADA monitoring | Partial (machine level only) | Medium | Real-time |
| AI-powered MES | Full (whole line) | High (clean, time-stamped) | Continuous |
For operations managers running connected production lines, this continuous view transforms how quickly you can act on emerging constraints before they become costly delays.
You do not always need a full mapping exercise to spot an emerging problem. These are the observable signals on the shop floor and in your KPI reports that warrant immediate investigation.
Watch for these red flags:
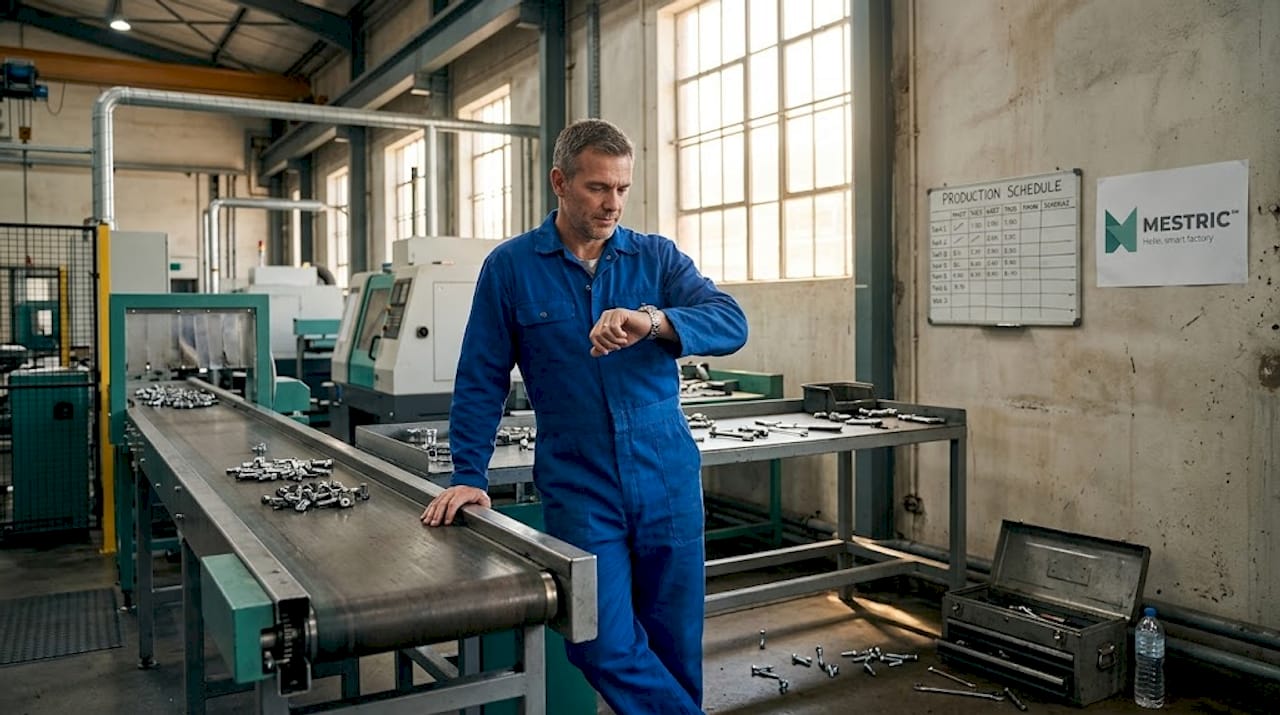
Material pileups and idle workstations are among the most reliable early indicators of a developing constraint. The combination of both signals simultaneously is particularly telling.
Beyond the visual cues, track these KPIs in your regular reporting: overall equipment effectiveness (OEE) per station, WIP inventory value by production stage, and delivery-on-time performance linked back to individual line segments. When one station’s OEE drops while its WIP queue rises, you have a bottleneck forming. The goal of production efficiency improvements is to catch these patterns early, before they compound.
I have worked with enough production environments to see the same mistakes appear repeatedly. The most common one is treating the first problem you find as the problem. A noisy machine gets replaced. The queue at that station clears for a week, then rebuilds elsewhere. The underlying constraint was never the machine.
In my experience, the analysis phase is almost always rushed. Teams move from observation to action without building the evidence timeline that separates a genuine root cause from a coincidental correlation. The data exists in most facilities. It simply is not organised before the decision gets made.
What I have learned is that balancing data with direct observation produces better outcomes than either alone. Numbers tell you where to look. Walking the floor tells you what is actually happening there. The combination is what gives you confidence in your diagnosis.
The iterative nature of this work is also underestimated. Resolving one bottleneck does not mean the job is done. Constraints shift, and the next limiting station becomes your new focus. Maintaining a culture where floor operators are regularly asked what is slowing them down is one of the most practical and underused tools available to any operations manager.
— Andraž

If you are spending more time reacting to production delays than preventing them, the right technology closes that gap significantly. Mestric’s Manufacturing Execution System connects directly to your equipment and surfaces real-time KPIs including downtime, cycle times, and queue data across every station on your line. You can see where efficiency is being lost before it becomes a missed delivery.
For operations managers ready to move from periodic audits to continuous monitoring, Mestric provides AI-powered analytics that track constraint scores, detect bottleneck migration, and support evidence-backed decision making. If you are evaluating your options, the MES versus traditional manufacturing comparison is a practical starting point. You can also request an onsite demonstration to see exactly how connected machinery performs in your specific production environment.
A production bottleneck is a stage in the manufacturing process where capacity is lower than demand, restricting output for the entire operation. Cycle time analysis is the standard method for identifying which step is the limiting factor.
Look for material backlogs building at a specific station, idle operators waiting downstream, and rising work-in-process inventory between two adjacent steps. These physical signals are among the most reliable early indicators of a constraint.
The Five Whys involves asking “why” repeatedly, typically five times, to move from a visible symptom to the underlying root cause. It prevents teams from fixing surface-level problems while the systemic issue remains unresolved.
Bottlenecks migrate because resolving one constraint exposes the next limiting stage in the process. Changes in product mix, demand, and shift conditions also cause the constraint point to shift, which is why real-time monitoring is more effective than periodic time studies.
You need cycle times per workstation, queue depths, equipment availability logs, throughput rates, and defect or rework rates. All data should be time-stamped to support accurate root cause analysis and trend detection.


 069 763 552