


TL;DR:
- Poor production data accuracy often leads to overestimated performance metrics and hidden losses in manufacturing. Implementing a real-time, automated tracking system with proper hardware infrastructure and high-frequency data collection reveals micro-stops and enhances decision-making. Regular validation, structured meetings, and continuous analysis foster meaningful factory improvements driven by precise performance insights.
Poor production data costs more than most managers realise. When your factory performance tracking workflow relies on manual logs, shift-end reports, or operator memory, you are not measuring performance. You are measuring paperwork. Hidden micro-stops, inaccurate downtime records, and overestimated OEE figures quietly erode productivity while daily meetings run on guesswork. This guide walks you through the prerequisites, step-by-step execution, common pitfalls, and verification methods needed to build a live, accurate, and genuinely useful tracking system in your facility.
| Point | Details |
|---|---|
| Start with the right hardware | PLCs, sensors, and edge gateways form the data foundation every reliable tracking workflow depends on. |
| Poll machine states every second | Intervals longer than one second miss micro-stops and produce inaccurate downtime records. |
| Automate OEE calculation locally | Running OEE logic at the edge reduces latency and reflects actual machine performance rather than operator estimates. |
| Validate against manual records | Compare automated data with hand-written logs early on to confirm your system is capturing the right events. |
| Feed insights into lean cycles | Pareto analysis and PDCA loops turn tracking data into sustained productivity gains over time. |
Before you build any factory performance tracking workflow, you need the right infrastructure in place. Skipping this step produces fast dashboards filled with unreliable data.
On the hardware side, your setup requires:
When direct PLC access is unavailable, stack light signals connected to an external PLC via isolation relays provide reliable automatic state detection. This approach suits older equipment and retrofit scenarios equally well.
On the software side, you need a data collection platform capable of time-series storage, an analytics layer for OEE calculation, and a dashboard layer for operator and management visibility. A well-architected OEE system separates these three concerns: edge/device layer, data storage layer, and analytics layer. This separation makes the system easier to scale and more resilient when any single layer needs updating.
| Layer | Components | Purpose |
|---|---|---|
| Edge/device | PLCs, sensors, edge gateway | Capture raw machine signals |
| Data storage | Time-series database (e.g. InfluxDB) | Store high-frequency state data |
| Analytics | OEE engine, AI tools | Calculate KPIs and surface insights |
| Visualisation | Dashboard, alert system | Deliver data to operators and managers |
Data quality deserves particular attention here. Standardise your machine states before anything else: running, idle, faulted, changeover, and planned maintenance. Ambiguous states produce ambiguous reports. Agree on definitions across shifts before your first data point is recorded.
Pro Tip: Set your polling interval to one second from the start. Five-minute polling intervals are insufficient to capture short downtime events and micro-stops, which are the losses most likely to go unnoticed.
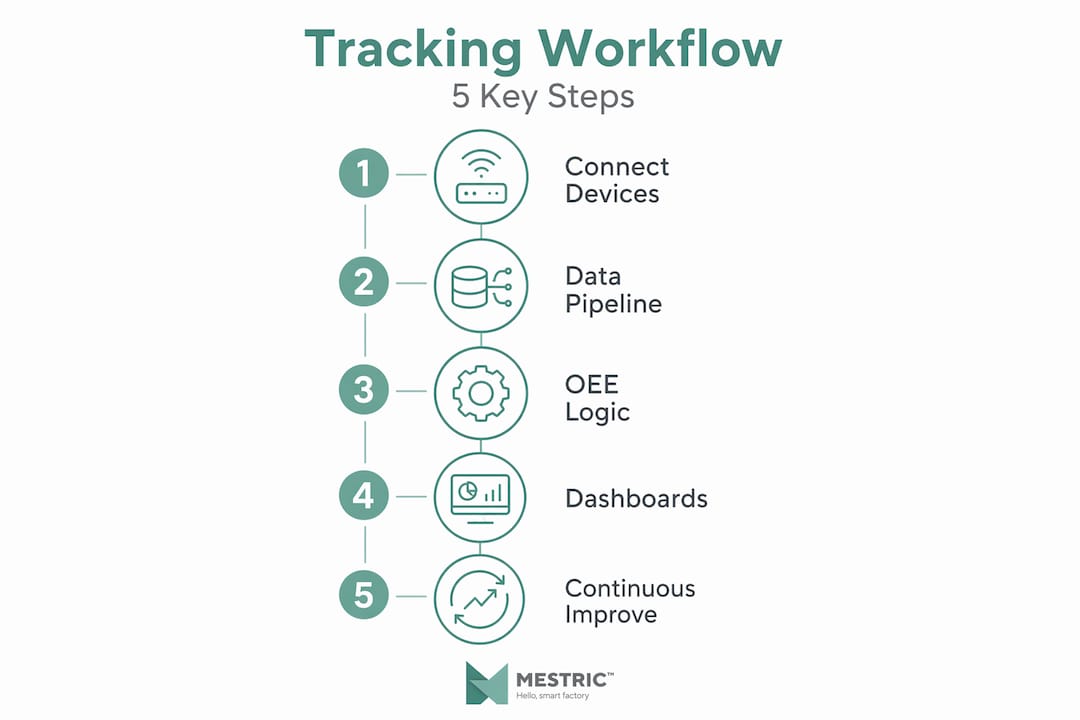
With infrastructure ready, you can begin constructing the actual workflow. Follow this sequence to ensure every layer works before adding complexity.
| Step | Action | Output |
|---|---|---|
| 1 | Connect PLC/sensors | Live state signal feed |
| 2 | Build MQTT pipeline | Data flowing to time-series DB |
| 3 | Write OEE logic at edge | Real-time OEE values |
| 4 | Set product targets | Accurate performance rate |
| 5 | Categorise downtime | Clean, structured stop records |
| 6 | Build dashboard | Live KPI visibility |
| 7 | Configure alerts | Immediate deviation notification |
One point worth noting for facilities running long-cycle machines or batch processes: OEE calculation logic must adapt to batch durations rather than per-unit cycle times. Standard timing adjustments through a state machine approach handle this correctly. Do not apply single-part cycle time logic to batch equipment or your performance scores will be meaningless.
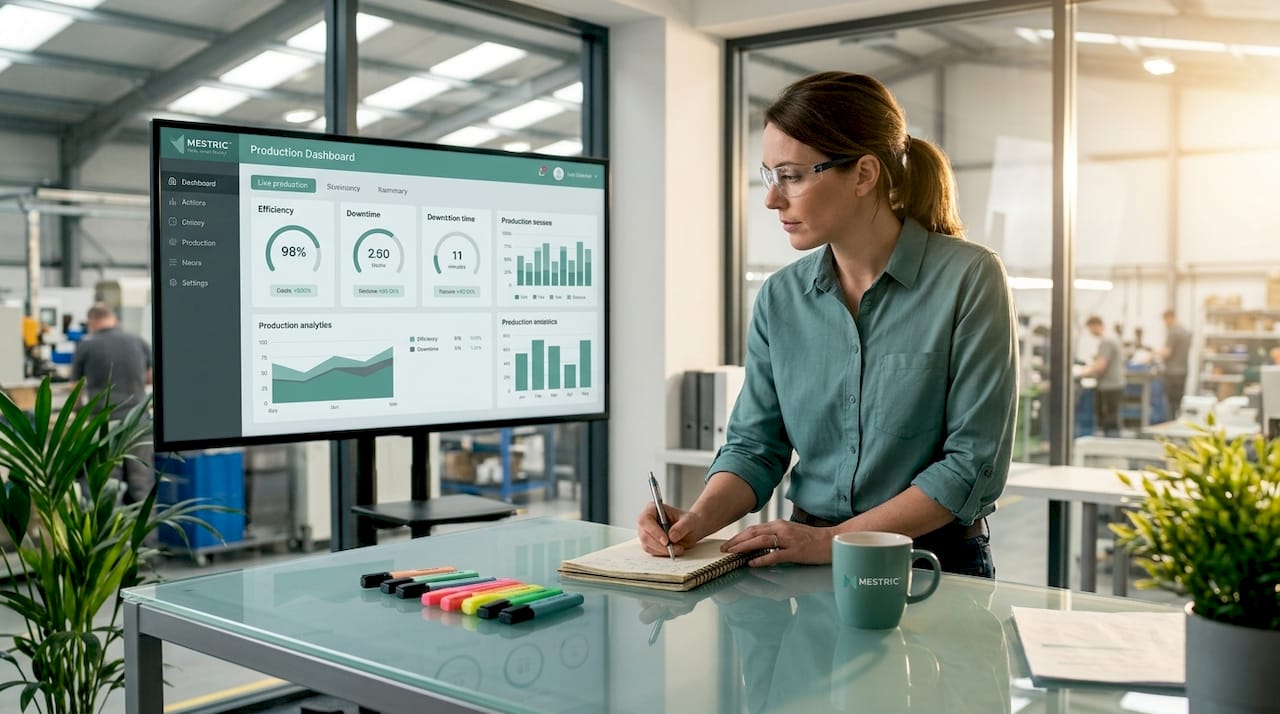
Pro Tip: For real-time production tracking to drive decisions, your dashboard needs to show losses clearly, not just OEE as a single number. Break out availability, performance, and quality losses separately so operators can act on the right cause immediately.
Even well-designed tracking systems produce poor results when these problems are not addressed early.
Manual data entry errors are the most common source of inflated performance metrics. Automated OEE tracking regularly shows results 5 to 15 percentage points lower than manual logs, because automated systems detect micro-stops that operators never record. This gap is not an error in the automated system. It is the truth your manual process was hiding.
Micro-stops are the silent killers of factory productivity. Short, frequent stoppages under two to five minutes rarely make it into manual downtime logs. Yet their cumulative impact on shift output is often larger than the long stops that everyone notices. Automated detection is the only reliable way to capture them.
Over-automating downtime classification creates a different problem. When the system assigns downtime reasons automatically without operator input, accountability erodes and data quality degrades over time. Experts recommend starting with manual input and only layering automatic classification later, once your category taxonomy is stable.
Meeting structure misuse undermines the value of the data you collect. Tier meetings in a lean daily management system should run as decision-making forums, not status report readings. Tier 1 meetings run 5 to 10 minutes, Tier 2 run 10 to 15 minutes, and Tier 3 run 15 to 20 minutes. Each tier should focus on escalation and clear action ownership, not recapping what the dashboard already shows.
Treat tier meetings as decision-making forums with clear action ownership and deadlines, not as status updates. Standard work and daily management
Pro Tip: Involve your operators in defining downtime categories from the start. When operators recognise their own language in the system, data entry improves and the output becomes genuinely useful for process improvement decisions.
Collecting accurate data is only half the job. The other half is using it systematically to improve your factory’s performance.
Begin validation by comparing your automated tracking output against manual shift records for the same period. This baseline comparison confirms your system is capturing events correctly and gives you a credible starting point for improvement discussions. Discrepancies above 5% in either direction warrant investigation before you rely on the automated data in meetings.
Once validated, interpret your OEE components deliberately. A low availability score points to unplanned downtime. A low performance score suggests speed losses or micro-stops. A low quality score indicates process instability or setup problems. Each component drives a different corrective action, and confusing them wastes investigation time.
The daily and weekly reporting workflow matters here:
The connection between factory efficiency analysis and continuous improvement only becomes real when you close the loop between data, decisions, and outcomes. Tracking without acting is just expensive record-keeping.
I have worked with manufacturing teams that genuinely believed their manual tracking was good enough. The most common version of this argument goes something like this: “Our operators know the machines better than any system ever will.” That is partly true. Operators do understand equipment behaviour deeply. But they cannot accurately recall how many two-minute stops occurred during a busy ten-hour shift. Nobody can.
What I have found is that the biggest shift in mindset happens not when teams see their first automated OEE score, but when they see their first micro-stop report. Automated, PLC-driven data capture gives you a high-resolution picture that manual methods simply cannot produce. The resistance to that data usually softens within two weeks once operators see it reflecting what they actually experience rather than what management hoped was happening.
The balance I would recommend: automate data capture completely, but keep operator input central to downtime classification and improvement discussions. Technology provides the data. People provide the context. Neither is sufficient on its own. The teams that get this right are the ones who treat the tracking system as a shared tool rather than a management surveillance instrument.
— Andraž
If your facility is ready to move from manual reports to live, connected performance data, Mestric is built specifically for this transition. Mestric connects directly to your manufacturing equipment and delivers real-time KPI monitoring across performance, downtime, quality, and cost, all in one place.

Unlike generic data tools, Mestric is designed as a full Manufacturing Execution System that combines live OEE tracking, AI-powered analysis, and production optimisation into a single connected platform. You get the infrastructure, the analytics, and the dashboards without building each layer separately. For manufacturing teams looking to reduce manual errors, identify bottlenecks faster, and make production decisions on real data, Mestric offers a practical, scalable path forward. Explore how Mestric can fit your factory’s specific tracking needs through an onsite demonstration.
A factory performance tracking workflow is a structured process for collecting, calculating, and acting on live machine and production data. It covers data capture from PLCs or sensors, OEE calculation, downtime categorisation, and regular reporting cycles.
OEE should be recalculated every 30 to 60 seconds for live operator feedback. This frequency provides near-instant visibility into performance losses without overwhelming the data pipeline.
Automated systems detect micro-stops and short events that operators rarely log manually. This is why automated OEE scores are typically 5 to 15 percentage points lower than manual records, reflecting actual performance more accurately.
Poll machine state tags every one second. Longer intervals, such as every five minutes, miss short downtime events and produce inaccurate performance and availability calculations.
Run a weekly Pareto analysis of downtime causes, identify the top losses, and assign corrective actions with clear owners. Feed results into a PDCA or Kaizen cycle and review trend data monthly to confirm improvements are holding.


 069 763 552