


TL;DR:
- Data-driven production focuses on converting raw operational data into actionable decisions, not just collecting more information. Implementing role-specific metrics and real-time visibility enables proactive responses, reducing waste and improving quality. A hybrid approach combining data models with physics principles offers the best reliability for complex manufacturing environments.
Most manufacturers have more data than they know what to do with. Sensors logging every cycle, ERP systems capturing every transaction, spreadsheets tracking every shift. Yet data-driven production explained properly is not about volume. It is about turning that raw information into decisions that actually change what happens on the shop floor. Many production teams still rely on reports compiled hours after the fact, which means they are reacting to problems that have already cost them time, materials, and quality. This article cuts through the confusion and gives you a clear picture of what data-driven production genuinely involves, what it delivers, and how to start.
| Point | Details |
|---|---|
| Data volume is not the goal | Being data-driven means converting raw data into decisions, not simply collecting more of it. |
| Five metrics get you started | Machine uptime, cycle times, on-time delivery, scrap rates, and schedule adherence are your foundation. |
| Real-time visibility changes behaviour | Moving from delayed reports to live data cuts response times and prevents defects from escalating. |
| Define KPIs before choosing tools | Setting clear business objectives before selecting platforms prevents dashboards that display but never drive action. |
| Hybrid models handle complexity | Combining data-driven analytics with physics-based models gives you accuracy without the risk of catastrophic failures outside training data. |
Understanding data-driven production starts with one important distinction. Collecting data and being data-driven are not the same thing. Data-driven production converts raw operational data such as cycle times, machine status, and quality measurements into operational intelligence, replacing gut-feel decisions with evidence at the point of action.
The core metrics that matter most in a production environment are:
The difference between collecting these metrics and being data-driven lies in what happens next. A data-driven operation has systems that surface these numbers to the right person, in the right format, at the moment they can still act on them. A production supervisor who sees a cycle time deviation at the end of a shift can only explain the loss. One who sees it as it happens can intervene.
Role-specific data views matter here. A machine operator needs to know their current cycle performance. A quality engineer needs scrap trends and defect categories. A plant manager needs throughput against the weekly schedule. One dashboard trying to serve all three typically serves none of them well.
The business case for adopting data-driven practices is not theoretical. Transitioning to data-driven manufacturing can reduce waste by 40% and cut response times from six hours to under 30 minutes. Those numbers reflect what happens when teams stop reacting to yesterday’s data and start acting on what is happening now.
The benefits fall into several distinct categories:
Pro Tip: Do not measure everything and report on it weekly. Pick the five metrics that directly connect to your biggest operational losses and build your reporting around those first. Speed of insight matters more than breadth.
Proactive management is the real shift. Most manufacturers operate reactively because their data reaches decision-makers too late. Real-time analytics change that dynamic entirely. When a quality deviation triggers an alert the moment it occurs rather than appearing in a morning report, the team can address the root cause before it affects another hundred units.
The most widely held misconception in data-driven production is that more dashboards mean better decisions. They do not. The biggest barrier is the lack of systems that translate data into immediate, usable decisions. Not data scarcity. A screen full of metrics that nobody acts on is not a data-driven operation. It is an expensive display.
Several pitfalls are worth knowing before you start:
Defining clear operational KPIs before selecting any analytics platform is the single most important step you can take to avoid these problems. What decisions do you need to make faster? What information would change how you respond? Answer those questions first, then choose your tools.
Pro Tip: Conduct a data audit before any platform purchase. Map each decision your team makes in a typical week and identify which ones are currently made without reliable data. That list is your implementation roadmap.
Practical implementation does not require a large data science team or an expensive platform. Starting with five foundational data points gets most manufacturers further than building complex analytics infrastructure too early. Here is a structured approach:
The table below illustrates how to connect data points to operational decisions:
| Metric | Trigger threshold | Responsible role | Response action |
|---|---|---|---|
| Machine downtime | More than 10 minutes unplanned | Shift supervisor | Log cause, escalate to maintenance |
| Scrap rate | Above 2% per hour | Quality engineer | Inspect last 50 units, identify defect pattern |
| Cycle time deviation | More than 5% above standard | Line operator | Check tooling, flag for engineering review |
| Schedule adherence | Below 90% by midshift | Production planner | Reprioritise sequence, adjust downstream scheduling |
Measurable business objectives must be defined before you instrument data sources. Otherwise, you risk building dashboards that display data without ever driving action. The goal is a living system where each metric triggers a defined response and that response is tracked.
Understanding the nuanced role of data analytics in production optimisation means knowing what these models can and cannot do. Manufacturers increasingly prioritise structured data analytics and rule-enhanced automation over fully autonomous AI systems, largely because of risk tolerance in production environments where errors carry real costs.
Data-driven models fall into several categories used in manufacturing:
The critical limitation to understand is this: data-driven models are fundamentally interpolators. They perform well within the range of conditions present in their training data, but can fail unpredictably outside those regimes. A physics-based model, by contrast, operates on established first principles and can reason about conditions it has never seen before.
| Model type | Strengths | Limitations | Best application |
|---|---|---|---|
| Data-driven | Fast to build, captures real-world complexity | Unreliable outside training data range | Stable, well-characterised processes |
| Physics-based | Reliable extrapolation, interpretable | Requires deep domain knowledge to build | Novel conditions, safety-critical decisions |
| Hybrid | Accurate within and beyond training range | More complex to develop and maintain | High-value, variable production environments |
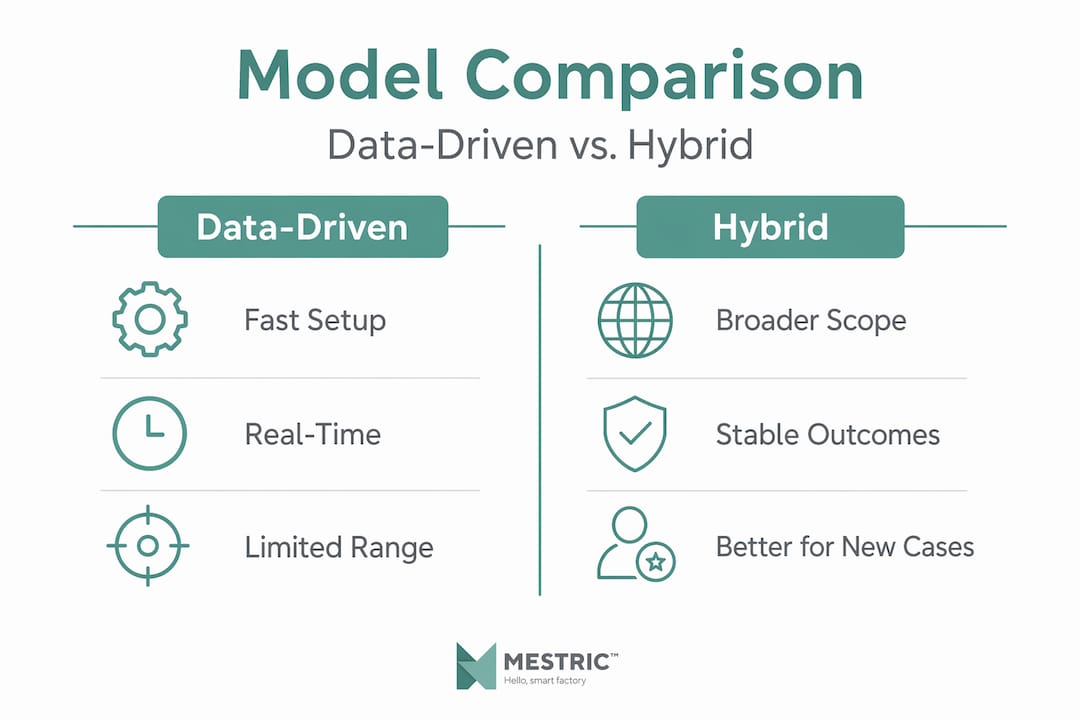
For most manufacturers, a hybrid approach combining data-driven insights with physics-based constraints gives the best balance of accuracy and reliability. Continuous retraining as conditions change, and clear awareness of your model’s operating envelope, are non-negotiable disciplines if you rely on these systems for production decisions.
I have worked with enough manufacturing teams to say this plainly: the gap is almost never in the data. It is in the system connecting that data to a human decision within the next ten minutes.
I have seen plants with impressive dashboards on every screen and supervisors who still make decisions based on what they saw this morning or what their most experienced operator thinks. The value lies in translating data insights into operational resilience and control, not in how sophisticated your analytics platform looks.
My consistent advice is to start with five numbers and make sure every person responsible for those numbers knows exactly what to do when one moves outside its threshold. That discipline, practised consistently, delivers more operational improvement than any large-scale platform rollout attempted without it.
The companies I have seen transform their operations did not start with AI or machine learning. They started with reliable, real-time visibility into the basics, then built from there. Once your team starts operating responsively because the data is trustworthy and immediately visible, the appetite for more sophisticated analytics grows naturally.
Dashboards that nobody acts on are not a technology problem. They are a process design problem. Fix that first.
— Andraž
Putting the principles of data-driven production into practice requires more than good intentions. You need a system that connects your equipment, consolidates your data, and surfaces the right information to the right person at the right time.

Mestric is a Manufacturing Execution System designed specifically for this. It connects directly to your production equipment and brings machine uptime, quality parameters, cycle times, and schedule adherence into a single, real-time view. Role-specific dashboards give your operators, quality engineers, and plant managers exactly what they need without the noise. And with AI-powered tools built in, Mestric helps you move from manufacturing efficiency insights to actual decisions faster than manual processes ever could. If you are ready to see what data-driven production looks like in a real production environment, explore how MES compares to traditional manufacturing and what the shift means for your operation.
Data-driven production is the practice of converting operational data such as machine uptime, cycle times, and scrap rates into decisions that directly improve production outcomes. It replaces delayed, gut-feel management with real-time, evidence-based responses.
The key benefits include up to 40% reduction in waste, significantly faster response times, improved quality control, and more proactive maintenance. These improvements come from having accurate, timely data at the point of decision.
Begin by defining two or three clear operational objectives, then instrument the five foundational metrics: machine uptime, cycle times, on-time delivery, scrap rates, and schedule adherence. Build role-specific dashboards and define a response protocol for each metric before expanding further.
The most common mistake is selecting a platform before defining what decisions it needs to support. Dashboards built without clear KPIs tend to display data without ever driving action.
Use a hybrid approach when your process operates across a wide range of conditions or when failures outside normal operating ranges carry significant cost or safety risk. Pure data-driven models are reliable interpolators but can fail unpredictably beyond their training data.


 069 763 552