


TL;DR:
- Automated reporting in factories streamlines data collection and report delivery using integrated digital systems. It enhances accuracy, speeds up reporting by up to 50%, and provides rapid ROI within months. Proper data normalization and stakeholder alignment are essential for successful implementation and reliable decision-making.
Automated reporting in factories is the systematic, software-driven collection, processing, and delivery of manufacturing performance reports without manual data entry. The industry term for this practice is production reporting automation, and it sits at the core of modern Manufacturing Execution Systems (MES), ERP platforms, and IoT-connected shop floors. Automated reporting systems pull data from machines, quality logs, and downtime records into a single validated workflow, then distribute structured reports to the right people at the right time. For plant managers and operations teams, this means less time compiling spreadsheets and more time acting on what the data actually says.
Automated reporting in factories refers to digital systems that replace manual report creation by connecting directly to data sources across the production environment. Those sources include CNC machines, PLCs, MES platforms such as Mestric, ERP systems, quality inspection logs, and maintenance records. The system collects raw data continuously, normalises it into a consistent format, applies business rules, and generates reports on a defined schedule or in response to specific triggers.
The workflow follows a clear sequence:
Strokovni nasvet: Set your exception thresholds before go-live. Alerts that fire too frequently become background noise within a week. Define what a genuine deviation looks like for each KPI and build that into the alerting logic from day one.
The benefits of automated reporting for factory operations are measurable and significant. Manufacturing teams that implement automated plant reporting can deliver reports 25–50% faster and reduce manual reporting work by up to 75%. That is not a marginal gain. It represents hours returned to engineers and supervisors every single shift.
The financial case is equally clear:
“The shift to automated reporting liberates management from manual report creation to focus on meaningful interpretation and continuous improvement.” — Automate Production Reporting in Manufacturing
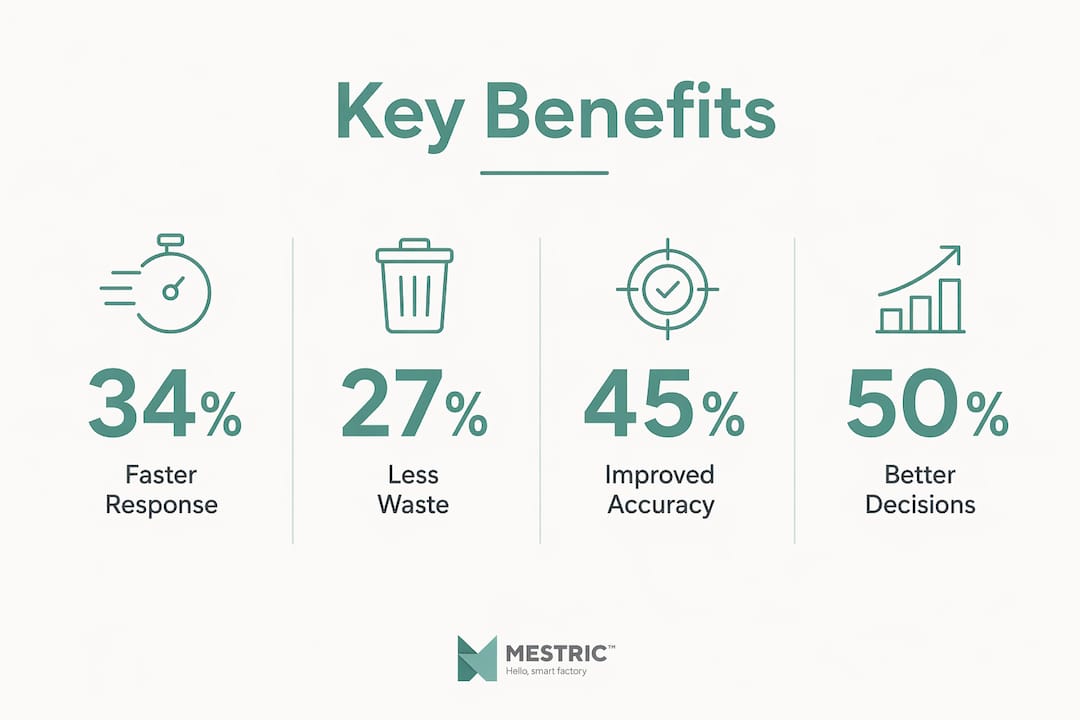
The cumulative effect is a factory that responds faster, wastes less, and makes better decisions at every level of the organisation.
Understanding the mechanics helps you plan a realistic implementation. Factory data automation depends on three things working together: clean data inputs, a reliable integration architecture, and clearly defined reporting outputs.

The most common failure point is data quality at the source. Machine data is often messy. Sensors produce noise. Different systems use different naming conventions for the same part or process. A normalisation layer sits between raw data and the reporting engine, cleaning and reconciling inputs before they reach any report. Skipping this step produces reports that look authoritative but contain errors that undermine trust across the organisation.
Integration architecture typically uses APIs to connect MES, ERP, and quality systems, with middleware orchestrating the data flow. Platforms like Mestric connect directly to manufacturing equipment, which removes the need for manual data entry at the machine level and ensures that production KPIs, downtime events, and quality parameters feed automatically into reporting workflows.
Report cadence matters as much as report content. Daily shift reports give supervisors an immediate view of output, scrap rates, and downtime causes. Weekly summaries reveal trends that single-shift data obscures. Monthly business reviews provide the strategic context that plant managers need for capacity planning and cost analysis. Each cadence serves a different decision-making need, and a well-designed system delivers all three without additional manual effort.
Reporting automation in manufacturing is not plug-and-play. Most implementations encounter predictable obstacles, and knowing them in advance saves significant time and cost.
The most frequent challenges include:
Strokovni nasvet: Run a data audit before you configure a single report. Map every data source, identify naming inconsistencies, and agree on a master data standard with your IT and operations teams. This groundwork determines whether your automated reports are trusted or ignored.
Stakeholder training is equally critical. The technology is only as effective as the people interpreting its outputs. Teams that understand what each report measures, and what action it should prompt, extract far more value from industrial reporting tools than those who treat reports as a compliance exercise.
Automated reports serve different functions depending on where you sit in the organisation. The table below shows the most common use cases, the report type that serves each one, and the operational decision it supports.
| Use Case | Report Type | Decision Supported |
|---|---|---|
| Shift handover | Daily shift summary | Output vs. target, downtime causes |
| Quality defect tracking | Weekly quality trend report | Scrap rate, rework cost, defect origin |
| Bottleneck identification | Real-time exception alert | Line rebalancing, maintenance scheduling |
| Capacity planning | Monthly business review | Headcount, machine investment, scheduling |
| Compliance and audit | Automated audit trail | Regulatory submissions, customer audits |
Automated reports commonly include daily shift summaries, weekly trend analyses, and monthly business performance reviews, each serving a distinct layer of operational oversight. The daily shift report gives a supervisor the facts needed for a five-minute handover meeting. The weekly trend report shows a quality manager whether a defect rate is improving or worsening over time. The monthly review gives the plant director the data needed to justify capital expenditure or workforce changes.
Production reporting software transforms raw shop floor events into structured data that supports decisions without manual compilation. This is particularly valuable for continuous improvement programmes such as Lean or Six Sigma, where data integrity and reporting speed directly affect the pace of improvement cycles. Compliance reporting also benefits significantly. Automated audit trails capture every production event in a validated, timestamped format, which reduces the preparation time for customer audits and regulatory submissions.
Automated reporting in factories delivers measurable gains in speed, accuracy, and decision quality when built on clean data and well-defined reporting logic.
| Točka | Podrobnosti |
|---|---|
| Core definition | Automated reporting collects, processes, and delivers manufacturing reports without manual data entry. |
| Speed and accuracy gains | Automated systems deliver reports 25–50% faster and achieve up to 95% data accuracy. |
| Strong financial ROI | Businesses typically see 340% ROI in year one, with payback within 6–11 months. |
| Data normalisation is non-negotiable | A normalisation layer must clean and reconcile machine data before it reaches any report. |
| Exception alerting over real-time overload | Alert on meaningful deviations only; constant data feeds reduce operator effectiveness. |
I have spent years working with plant managers who are genuinely skilled at reading their factory floor. They know when something is wrong before the data confirms it. The problem is that their instincts are only as good as the information they receive, and in most factories, that information arrives too late, in the wrong format, or with errors baked in from manual entry.
What automated reporting actually changes is not the technology. It changes the conversation. When a plant manager walks into a morning meeting with a validated shift report already on the screen, the discussion moves immediately to what caused the downtime and what will be done about it. Without automation, the first fifteen minutes of that meeting are spent arguing about whether the numbers are right.
The factories I have seen get the most from reporting automation share one characteristic: they invested in data quality before they invested in dashboards. The temptation is to build beautiful reports quickly. The discipline is to fix the underlying data first. Teams that skip normalisation end up with automated reports that are wrong at speed, which is worse than manual reports that are wrong slowly.
My practical advice is this: start with one report that your team already produces manually and automate that single output completely before expanding. Prove the accuracy, build the trust, and then scale. The technology supports production optimisation at scale, but adoption depends on people believing the numbers they see.
— Andraž
Mestric is built specifically for manufacturing teams who need accurate, real-time production data without the overhead of manual reporting. The platform connects directly to your equipment, captures KPIs including performance metrics, downtime, quality parameters, and cost analysis, and delivers them through structured reports and dashboards that your team can act on immediately.

If you are evaluating how a modern MES compares to your current approach, the MES vs traditional manufacturing guide covers the operational and financial differences in detail. Mestric also supports real-time performance tracking across your production lines, giving you the foundation that makes automated reporting reliable from day one. Book an onsite demonstration to see how connected machinery transforms your reporting workflow in a live production environment.
Automated reporting in a factory is the use of digital systems to collect data from machines, MES, and ERP platforms and generate production reports without manual input. Reports are delivered on a set schedule or triggered by specific production events.
Automated systems remove manual data entry from the reporting process, which eliminates transcription errors. Research shows automated reporting achieves up to 95% data accuracy compared to manual processes.
Automated factory reports draw from machines, PLCs, MES platforms, ERP systems, quality inspection logs, and maintenance and downtime records, all integrated through APIs and middleware.
Companies typically achieve payback within 6–11 months of implementing reporting automation, with a 340% return on investment recorded in the first year.
Exception-based alerting sends notifications only when a KPI deviates meaningfully from its target, rather than broadcasting all data continuously. This approach reduces operator overload and focuses attention on production issues that require action.


 069 763 552