


TL;DR:
- Manufacturers often overlook the significant benefits of cycle-time optimization, which can reduce lead time and costs substantially. Proper measurement, targeted improvements, and discipline are essential to sustain gains, whereas relying on generic benchmarks and neglecting plant-specific factors impede progress. Implementing connected MES solutions like Mestric™ helps achieve reliable data and accelerates continuous improvement.
Many manufacturers assume that trimming a few minutes from a production cycle is a marginal gain, barely worth the disruption. That assumption is costing you more than you realise. Lean manufacturing evidence documents statistically significant reductions in both lead time and unit production cost following structured cycle optimisation. The compounding effect across thousands of production runs means even small cycle improvements translate directly into stronger margins, faster deliveries, and a more competitive position. This article explains exactly what production cycle optimisation involves, what the data says, and how you can start capturing those gains without falling into common traps.
| Point | Details |
|---|---|
| Reliable measurement is essential | Cycle-time improvements are only meaningful when baselines and data definitions are robust. |
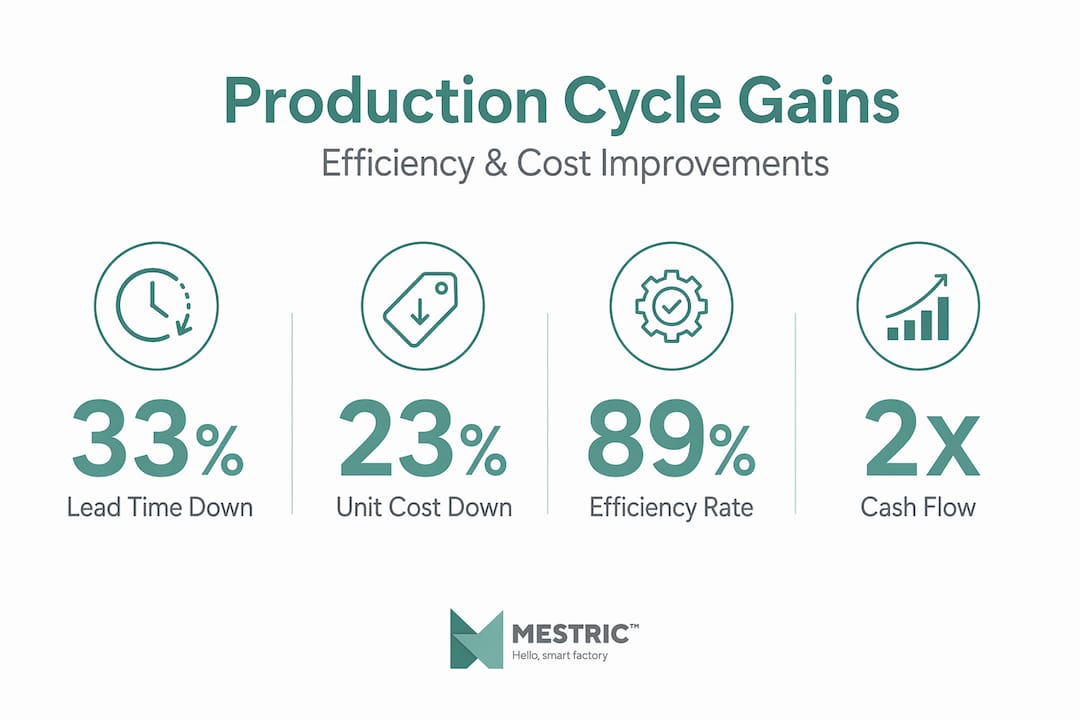
| Results can be dramatic | Case studies show 33% shorter lead times and 23% cuts in production costs. |
| Industry context matters | Benchmarks and methods should be adapted to fit sector-specific realities. |
| Avoid common mistakes | Generic KPIs and poor measurement are leading causes of failed optimisation attempts. |
| Start small and build momentum | Initial workflow mapping and targeted improvements provide a practical path to sustained gains. |
Now that you appreciate the significant potential, let’s clarify what cycle-time optimisation actually involves in practice.
The production cycle covers every step from releasing a work order to a finished, quality-approved product leaving the line. Cycle time is the elapsed time to complete one unit or batch through a defined process. That sounds straightforward, but the measurement becomes complicated the moment you factor in stoppages, rework loops, inspection holds, and changeovers.
Optimisation is frequently misunderstood as simply “going faster.” In reality, it means achieving the right balance of:
To improve any of these dimensions, you must measure them reliably first. The key metrics to capture include:
Unreliable baselines create illusory improvements. A line that appears 15% faster after a kaizen event may simply be recording cycle time differently than before. Reliable baseline measurement, whether through DMAIC Measure phases or OEE-style instrumentation, is the single most important prerequisite before any optimisation action.
“If your definitions of availability, performance, and quality are inconsistent across shifts or machines, your OEE number tells you little about where to act.” This is especially relevant when comparing performance across different cells or production lines.
Good production process optimisation always starts with measurement discipline, not with solutions.
Pro Tip: Before launching any improvement project, spend two to four weeks collecting cycle-time data manually alongside your existing system. Discrepancies between the two reveal where your measurement gaps are. Fix those first.
With definitions clear, here’s why the effort is justified — hard data from real-world manufacturing improvements.
The numbers from documented Lean implementations are striking. Lead time reductions of 33% and unit production cost reductions of 23% have been recorded in peer-reviewed studies of manufacturers applying structured cycle optimisation. Those are not theoretical projections — they are measured outcomes from plants that committed to the process.
| Metric | Before optimisation | After optimisation | Improvement |
|---|---|---|---|
| Average lead time | 18 days | 12 days | 33% reduction |
| Unit production cost | Baseline index 100 | Index 77 | 23% reduction |
| First-pass yield | 84% | 93% | 9 percentage points |
| Changeover time | 95 minutes | 41 minutes | 57% reduction |
These improvements are not isolated to one sector. Similar patterns appear across discrete assembly, process manufacturing, and mixed-model production environments.
At the business level, what do these gains actually mean?
Faster cash flow. Shorter lead times mean finished goods leave your facility sooner, accelerating invoicing and collections. A 33% reduction in lead time on a 15-day cycle gets product to your customer five days earlier — every single run.
More responsive supply chains. When your cycle time is predictable and your lead time is short, you can commit to tighter delivery windows with confidence. That is a direct competitive advantage in markets where on-time delivery performance determines contract renewals.
Stronger margins. A 23% reduction in unit production cost does not require a price increase to improve profitability. It compounds across every unit produced. For a plant making 50,000 units per year, that cost reduction can represent millions in recovered margin.
Investing in cost-saving efficiency methods is not optional for manufacturers competing on value. The data makes that clear.
The evidence shows what you stand to gain. Now let’s break down how top manufacturers achieve these results and where context matters.

The most widely proven frameworks are Lean manufacturing, Six Sigma, and their combination. Lean Six Sigma approaches link cycle-time improvement to waste elimination and variation reduction using structured problem-solving through DMAIC: Define, Measure, Analyse, Improve, and Control. Value Stream Mapping (VSM) adds a visual layer, showing exactly where time and material flow are being interrupted across your entire value chain. VSM and related flow tools have been shown to reduce both lead time and cycle time across diverse manufacturing engineering environments.
| Tool or method | Best suited for | Key output |
|---|---|---|
| Value Stream Mapping | Complex multi-step lines with visible bottlenecks | Visual map of waste and flow interruptions |
| DMAIC (Six Sigma) | Processes with high variation or quality defect costs | Root-cause elimination and controlled improvements |
| Kaizen events | Focused, quick wins in specific cells or operations | Rapid, team-driven local improvements |
| Lean line balancing | Assembly lines with uneven workloads across stations | Balanced takt time across all workstations |
| SMED (changeover reduction) | High-mix, low-volume environments | Significantly reduced changeover time |
A model cycle-time optimisation process for any plant typically follows these steps:
A thorough process improvement guide can support each of these steps in detail. For plants ready to move from planning to action, a step-by-step optimisation framework can reduce the time between commitment and first results. Process mapping approaches are particularly valuable in the early stages when you need to understand your current state honestly.
Pro Tip: Do not import OEE targets from other industries. A world-class OEE of 85% is a reasonable benchmark in high-volume discrete manufacturing, but in pharmaceutical or complex process environments, an “acceptable” OEE may be considerably lower due to mandatory inspection, regulatory hold times, and cleaning validation. Set targets that reflect your actual operating constraints.
With the “how” established, it is vital to avoid the traps that have derailed many well-intentioned optimisation programmes.
The most frequent errors are not technical. They are strategic and measurement-related. Here are the most damaging mistakes and how to steer clear of them:
Using generic benchmarks as targets. Many teams adopt a universal “world-class OEE of 85%” without questioning whether that figure applies to their process. OEE targets vary significantly by industry, and benchmarks designed for high-volume continuous processes are misleading when applied to regulated, inspection-heavy, or highly variable environments.
Ignoring plant-specific context. A solution that worked brilliantly in an automotive stamping plant may fail completely in a food processing line. Product mix, regulatory requirements, and equipment age all affect what “optimised” looks like for you specifically.
Setting targets before establishing baselines. Committing to a 20% cycle-time reduction when your current measurement system has a 15% error margin is setting yourself up for confusion. Fix your measurement infrastructure before setting improvement targets.
Optimising locally while ignoring system-level flow. Speeding up one machine that feeds a slower downstream process does not improve throughput — it creates inventory pile-up and hides the real constraint.
Failing to sustain improvements. Short-term kaizen gains frequently erode within six months if standard work and visual controls are not embedded. Improvement without control is temporary.
Pro Tip: Build your KPI framework around your product families and process types, not around generic industry reports. A well-designed optimisation checklist aligned to your plant’s constraints will outperform any borrowed benchmark from an unrelated sector. A solid MES-driven efficiency workflow can help you automate the data collection that makes those KPIs reliable.
Understanding what not to do, here is a starter blueprint to ensure your first cycle optimisation steps deliver visible impact.
Value stream and flow optimisation tools support several of these steps directly, particularly the mapping and analysis phases. For detailed guidance on structuring your workflow, a workflow streamlining steps resource can help you sequence actions logically. For teams newer to the discipline, a practical guide on streamlining process best practices covers the foundational principles clearly.
Pro Tip: Target your first quick win within 30 days. A single changeover reduction or elimination of a queue wait that visibly cuts cycle time builds internal credibility for the broader programme and keeps momentum alive when the harder improvements take longer.
Here is something we observe consistently: the tools, frameworks, and evidence are all available. Lean, Six Sigma, VSM, DMAIC — none of these are new or secret. Yet cycle-time performance in many plants remains stubbornly flat year after year. The gap is rarely technical.
The real obstacles are cultural and structural. Teams measure what is easy to record, not what actually drives performance. Managers inherit benchmarks from industry reports without questioning whether those numbers apply to their lines. Improvement projects launch with energy and then quietly stall when short-term pressures demand attention elsewhere.
There is also a pattern of precision avoidance. Establishing a true baseline is unglamorous work. It takes weeks, involves disagreements about definitions, and can surface uncomfortable truths about current performance. Many teams skip it, jump to solutions, and then wonder why the improvements do not stick or cannot be quantified.
The harder truth is that cycle optimisation is not a project with a finish line. It is a discipline. Plants that sustain gains are the ones where reviewing performance data, questioning standards, and updating processes are simply part of how work gets done — not a special initiative. That mindset shift is what separates plants that show a 33% lead-time reduction from those that produce a slide deck and then revert to the previous state.
Our perspective: localise everything. Generic advice applied broadly produces average results at best. The manufacturers who achieve lasting gains treat their plant’s specific constraints, product mix, and people as the starting point, not an afterthought. A detailed optimisation walkthrough built around your actual context will always outperform a generic industry playbook.
Blending structured tools with local knowledge, and then repeating the cycle relentlessly, is what makes gains compound rather than fade.
If your cycle optimisation efforts have stalled or your measurement data remains unreliable, the gap between intention and result often comes down to tooling and process infrastructure.
Mestric™ gives production managers real-time visibility into cycle time, downtime, and quality metrics directly from connected equipment — so your baselines are accurate, your KPIs are live, and your decisions are grounded in fact rather than estimates. Understanding MES vs traditional manufacturing approaches can clarify why connected systems accelerate what manual tracking cannot. If you are ready to act, our guide on production operation streamlining shows how leading manufacturers structure that transition. You can also explore the full range of manufacturing software options to understand exactly where Mestric™ fits in your technology stack.
Lean implementation studies show statistically significant reductions in lead time and unit production cost within months of structured implementation, particularly when baselines are established correctly from the outset.
No. World-class OEE varies widely by sector and process type, so targets designed for high-volume discrete manufacturing can be entirely misleading when applied to regulated or inspection-heavy environments.
Lean Six Sigma and DMAIC provide robust structured frameworks, but they must be adapted to account for sector-specific constraints such as regulatory hold times, cleaning validation, and mandatory inspection steps.
No. VSM and flow optimisation focus on eliminating waste in sequencing, wait time, and material flow — gains typically come from better process design and measurement rather than workforce reductions.


