


TL;DR:
- Production downtime is any period when equipment is scheduled to run but isn’t producing output.
- Consistent downtime definitions are crucial for accurate benchmarking, resource allocation, and strategic decisions.
- Improving tracking, analysis, and culture around downtime can save significant production hours annually.
The average plant loses 30 hours of production every single month to downtime. That is nearly a full working week gone before you have had a chance to act on it. Yet despite how costly this is, many manufacturing leaders still work from inconsistent or incomplete definitions of what downtime actually means. Some count only major breakdowns. Others exclude planned maintenance or minor stoppages entirely. This article gives you a clear, precise definition of production downtime, explains why that definition matters for every KPI you track, and walks you through practical steps to identify and reduce losses across your operation.
| Point | Details |
|---|---|
| Clear downtime definition | A precise definition ensures meaningful analysis and benchmarking for manufacturing leaders. |
| Downtime directly impacts efficiency | Unplanned stoppages can represent up to 15% of production time, affecting profit and KPIs. |
| Root cause focus is key | Identifying exact sources of downtime enables tailored, effective reduction strategies. |
| Digital tracking boosts improvement | Automated, real-time monitoring increases visibility and accelerates corrective actions. |
Production downtime is any period during which equipment or a production line is scheduled to run but is not producing output. That sounds simple enough. In practice, however, the definition gets blurry fast. Is a ten-minute changeover downtime? What about a brief material shortage? What if a machine runs but produces scrap? Getting these boundaries wrong means your data is wrong, and your decisions follow.
The two primary categories you need to distinguish are:
A third category worth tracking separately is minor stoppages, sometimes called micro-stoppages. These are brief interruptions under a few minutes that operators often resolve without logging. Individually they seem negligible. Collectively, they can consume a significant share of your available capacity.
To measure downtime consistently, you need a reliable denominator. In most frameworks, this is Plant Production Time (PPT), which represents the total time a plant is available and scheduled for production. Downtime is then expressed as a proportion of PPT. This feeds directly into Overall Equipment Effectiveness (OEE), one of manufacturing’s most widely used performance metrics. OEE combines availability, performance, and quality into a single figure, and downtime directly drives the availability component.
| Downtime type | Example | Trackable? |
|---|---|---|
| Planned maintenance | Scheduled lubrication, part replacement | Yes, always |
| Unplanned breakdown | Conveyor belt failure | Yes, always |
| Changeover | Product or format change | Yes, often underreported |
| Minor stoppage | Sensor fault cleared in 3 minutes | Often missed |
| Material shortage | Line waits for component delivery | Sometimes excluded |
Unplanned downtime typically accounts for 5 to 15% of Plant Production Time across manufacturing sectors. That range is wide because definitions vary. If your plant excludes minor stoppages or informal pauses, you are almost certainly undercounting. A good productivity checklist helps you align these definitions before you start measuring.
Here is where the stakes become very real. If two plants in your organisation define downtime differently, you cannot benchmark them against each other. If your quality team excludes changeovers and your operations team includes them, your OEE figures are incomparable. Inconsistent definitions do not just create reporting headaches. They actively mislead strategic decisions.

Consider benchmarking. World-class OEE sits at 85%, while typical plants operate closer to 60%. That 25-point gap often hides significant downtime that is either miscategorised or simply not tracked. If you believe your plant is performing at 75% but you are excluding changeover time and minor stoppages, your actual figure may be far lower.
A consistent, agreed definition allows you to:
Unclear downtime definitions are not just a data quality issue. They are a strategic risk. When leadership cannot trust the numbers, they cannot make reliable decisions about where to invest or where to cut.
There are also hidden costs in the grey areas. Events that fall outside your current downtime definition still consume time, resource, and output. They just do not appear in your reports. Tracking them, even informally at first, often surfaces the largest untapped efficiency gains. Explore cost-saving methods and a production optimisation guide to understand how other plants have tackled this problem systematically.
Pro Tip: Before you invest in new tracking technology, invest thirty minutes in getting your cross-functional team to agree on a single written definition of downtime. It sounds basic. It is the step most plants skip, and it is the reason their data never quite adds up.
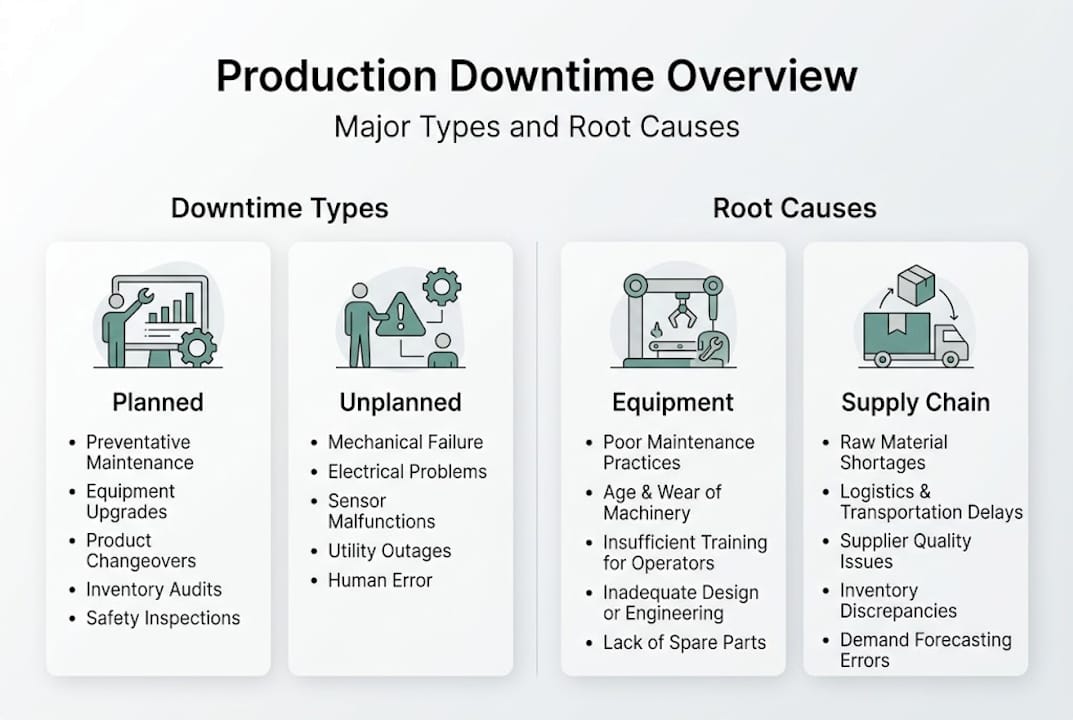
Once you have a clear definition, you need to understand the landscape of downtime types. Not all downtime has the same cause, the same frequency, or the same fix. Treating all stoppages the same way is one of the most common and costly mistakes in manufacturing management.
Here is a comparison of planned versus unplanned downtime:
| Category | Description | Typical examples |
|---|---|---|
| Planned downtime | Scheduled, anticipated stoppages | Preventive maintenance, calibration, line changeovers |
| Unplanned downtime | Unexpected failures and disruptions | Machine breakdowns, quality holds, raw material delays |
The most common downtime sources across manufacturing include:
Industry context matters enormously here. Food and beverage operations typically see around 15% unplanned downtime, driven by hygiene requirements, ingredient variability, and short product runs. Automotive lines face a different profile, with high volumes of planned changeovers but very low tolerance for unplanned stoppages. Knowing your industry baseline shapes which countermeasures make sense.
Root cause analysis is essential once you have classified your downtime events. A Pareto chart, which ranks causes by frequency and impact, quickly reveals whether your losses are driven by one or two chronic issues or spread across many sporadic events. Chronic problems call for systematic fixes, such as redesigned maintenance schedules or improved quality monitoring. Sporadic events often require faster response protocols and better detection capability. Understanding which type you are dealing with determines the right efficiency workflow with MES to apply. You may also find value in reviewing maintenance workflow optimisation approaches used in related industries.
Knowing what downtime is and where it comes from is only useful if you act on it. Here is a structured approach that works across plant sizes and sectors.
Plants lose an average of 360 hours per year to downtime. That is nine full 40-hour working weeks. Even recovering 20% of that through better tracking and faster response translates directly into output, margin, and competitiveness. A detailed process improvement guide can help you structure this work across your plant. You should also address reducing manual errors as part of your data collection process, since inaccurate recording is one of the leading reasons downtime goes underreported.
Pro Tip: Do not wait until you have perfect data to start acting. Even rough classifications of your top three downtime causes will give you enough signal to make meaningful improvements in the first 90 days.
Here is what most guides on this topic do not say clearly enough. Most plants are operating well below world-class OEE and are routinely missing hidden or misclassified sources of downtime. The technology to track this properly exists. The problem is usually not technical.
The real barriers are cultural. Operators do not log short stoppages because they feel it reflects poorly on their performance. Supervisors round up availability figures to avoid difficult conversations. Leadership sees a headline OEE number and assumes it is accurate. These dynamics mean that even plants with good systems routinely undercount their losses.
The leaders who genuinely close the gap between typical and world-class performance do two things differently. First, they invest in real-time digital tracking that removes the burden of manual reporting and captures micro-stoppages automatically. Second, they build a culture where reporting downtime accurately is seen as professional and valuable, not as an admission of failure.
Surface-level KPIs will only get you so far. The real gains come from cross-referencing your digital data with shop floor feedback, reviewing trends across shifts, and treating downtime analysis as a daily discipline rather than a monthly report. That kind of operational transparency is what separates plants that consistently improve from those that plateau. Staying current with manufacturing trends 2026 will help you understand where the industry is heading and what capabilities are becoming standard.
If this article has made one thing clear, it is that downtime reduction starts with definition and visibility. Once you know what you are measuring and why, every subsequent decision becomes sharper.
Mestric™ gives you the real-time production tracking, automated downtime logging, and AI-powered analytics to move from reactive reporting to proactive control. Whether you are evaluating MES vs traditional manufacturing approaches, looking to streamline production operations, or exploring the full range of manufacturing software types available to your plant, Mestric™ connects directly with your equipment to surface the insights you need. Book an onsite demonstration and see the difference real-time data makes.
Any period scheduled for production but not running counts as downtime. This includes both planned stoppages such as maintenance and unplanned events such as equipment failures, regardless of duration.
Unplanned downtime disrupts output without warning, triggering rush costs, SLA penalties, and knock-on delays across the supply chain. World-class manufacturing keeps unplanned downtime below 5% of Plant Production Time by prioritising preventive and predictive maintenance.
The most effective approach combines digital event tracking, structured root cause analysis, and preventive maintenance schedules. Continuous improvement techniques applied consistently over time yield the most sustained reductions.
Average plants lose around 360 hours per year to downtime, equivalent to roughly 30 hours per month. The exact figure varies significantly by industry, equipment age, and the rigour of your tracking practices.


