


TL;DR:
- True process optimisation enhances quality, resilience, and adaptability beyond just cost-cutting.
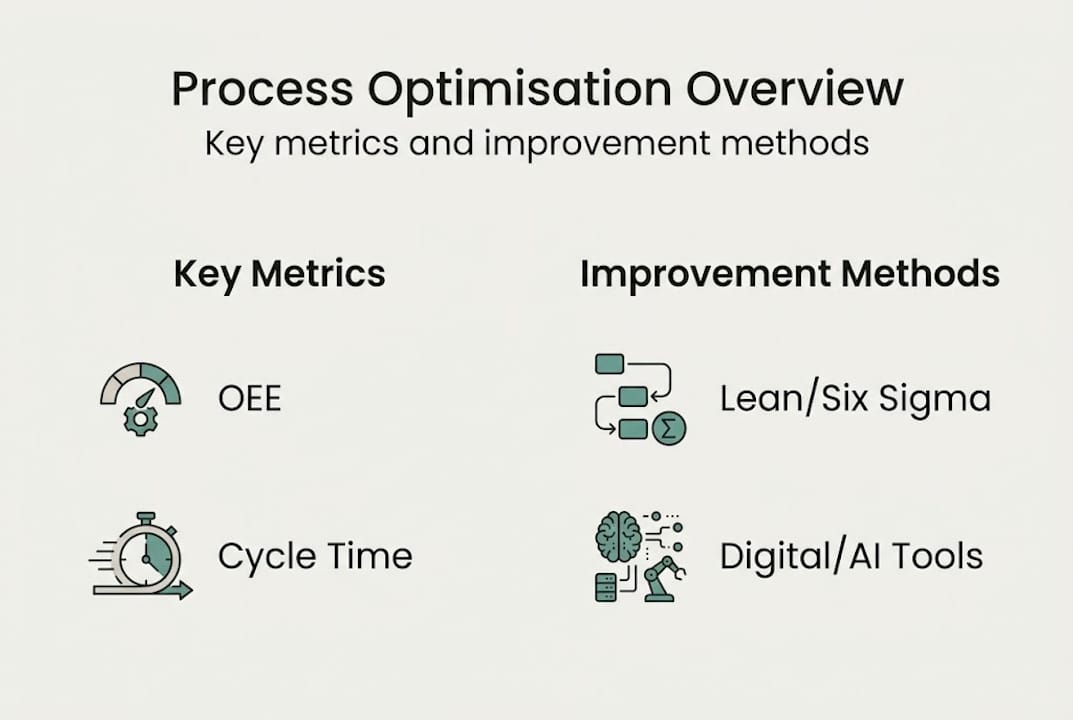
- Key metrics like OEE, cycle time, and quality indicators help monitor improvement success.
- Combining traditional lean methods with digital tools creates a strategic, adaptable manufacturing capability.
Process optimisation is widely misunderstood. Many manufacturing executives treat it as a cost-cutting exercise, a way to trim budgets and reduce headcount. But that framing leaves enormous value on the table. True process optimisation is a strategic discipline that improves quality, builds operational resilience, and positions your facility to adapt quickly when markets shift. This guide clarifies exactly what process optimisation means in 2026, which metrics matter most, how traditional and digital approaches compare, and what your first practical steps should look like. Whether you are refining existing workflows or planning a broader digital transformation, this article gives you a clear, actionable framework.
| Point | Details |
|---|---|
| Process optimisation is strategic | It’s more than cost savings—it’s about ongoing adaptation and competitiveness. |
| Metrics are essential | Track key measures like OEE and cycle time to assess and guide optimisation efforts. |
| Digital and traditional methods differ | Modern tools offer flexibility but require strong data, whereas Lean/Six Sigma focus on standardisation. |
| Tackle challenges in stages | Start with bottlenecks, pilot new tools, and involve the workforce for lasting improvement. |
Before you can improve a process, you need a precise understanding of what you are improving. Process optimisation is not simply about working faster or cutting corners. It is about working better, with evidence guiding every decision.
Process optimisation in manufacturing is the systematic improvement of production workflows to maximise efficiency, reduce costs, and enhance quality by eliminating bottlenecks, minimising waste, and optimising resource use.
That definition matters because it sets three equally important goals: efficiency, cost, and quality. Sacrifice one for another and you create new problems. A line that runs faster but produces more defects has not been optimised. It has simply been accelerated.
In practice, process optimisation in manufacturing covers a wide range of activities. Here is what it typically involves:
The modern version of this process is evidence-based and continuous. It is not a one-off project. It is an ongoing discipline built into how your facility operates. Understanding manufacturing metrics essentials is a strong foundation for this work, because you cannot optimise what you cannot measure. The goal is to build a culture where improvement is expected, not exceptional.
With a clear definition in place, the next question is: how do you know if your optimisation efforts are working? The answer lies in selecting the right metrics and monitoring them consistently.
Key metrics for monitoring include OEE (Overall Equipment Effectiveness), cycle time, KPIs, process capability, and quality metrics. Each one tells a different part of the story.
| Metric | What it reveals | How to use it |
|---|---|---|
| OEE | Combined availability, performance, and quality rate | Benchmark equipment health and set improvement targets |
| Cycle time | Time to complete one unit or batch | Identify slowdowns and compare against targets |
| Process capability (Cpk) | How consistently a process meets specification | Flag variability before it becomes a defect |
| First pass yield | Percentage of units passing without rework | Measure true quality at each production stage |
| Downtime rate | Planned vs. unplanned equipment stops | Prioritise maintenance and scheduling decisions |
Building a dashboard around these metrics gives both operators and executives a shared view of performance. Operators see real-time signals. Executives see trends and patterns. When both groups are looking at the same data, decisions become faster and more aligned.
A few practical points worth noting:
For guidance on tracking manufacturing KPIs effectively, and to explore smart KPI examples relevant to your production environment, it helps to start with a small, focused set of indicators rather than overwhelming your team with data.
Once your metrics are in place, you face a strategic choice: refine your existing processes using proven methodologies, or invest in digital and AI-driven tools that offer new capabilities. Both paths have genuine merit, and both carry real trade-offs.
Lean manufacturing and Six Sigma are the established frameworks. Lean focuses on eliminating waste across the value stream. Six Sigma uses statistical analysis to reduce process variation. Together, they have delivered measurable results across thousands of facilities worldwide. However, they can be slow to implement, require significant training, and sometimes struggle to keep pace with rapid market changes.
Digital and AI-driven approaches offer something different. AI in process optimisation enables predictive maintenance, real-time anomaly detection, and dynamic scheduling that traditional methods simply cannot match. But as smart factory trade-offs show, this flexibility is never free. Complexity increases, data governance becomes critical, and poorly managed implementations can introduce new failure points.
| Dimension | Traditional (Lean/Six Sigma) | Digital/AI-driven |
|---|---|---|
| Speed of implementation | Slower, structured rollout | Faster deployment, longer integration |
| Data requirements | Moderate, often manual | High volume, must be clean and reliable |
| Flexibility | Structured but less adaptive | Highly adaptive, context-sensitive |
| Risk profile | Lower upfront risk | Higher complexity, requires governance |
| Best suited for | Stable, high-volume processes | Variable, data-rich environments |
The most effective manufacturers in 2026 are not choosing one or the other. They are combining both. Lean principles provide the discipline. Digital tools provide the speed and scale.
Pro Tip: Always validate early wins with hard data before scaling a new optimisation approach. A pilot that looks promising in week two may reveal hidden costs by week eight.
Both analogue and digital approaches come with real obstacles. Understanding them before you start saves significant time and frustration.
The most common barriers to successful process optimisation include process variability, legacy systems, and poor data quality. These are not edge cases. They are the everyday reality for most manufacturing operations.
Here is how each challenge typically appears and what you can do about it:
A step-by-step optimisation approach is far more effective than a sweeping overhaul. Pilots allow you to test assumptions, build confidence, and demonstrate value before committing larger resources.
Pro Tip: Target a single bottleneck for your first optimisation step, not every process at once. One clear win builds momentum and earns the trust of both leadership and the shop floor.
With the pitfalls mapped out, you need a clear starting point. Here is a practical roadmap designed for manufacturing executives who want to move from intention to action.
This process improvement guide can support each stage, but the sequence below gives you the strategic logic behind the steps.
This is not a linear project with a defined end date. It is a repeating cycle. Each iteration builds on the last, and over time, the cumulative effect on efficiency, quality, and cost is substantial.
Here is a view that most operational guides avoid: process optimisation is not primarily an efficiency exercise. It is a strategic capability.
When manufacturers treat optimisation as a cost project, they stop when the savings are achieved. When they treat it as strategy, they build a facility that can respond quickly to supply chain disruptions, regulatory changes, and shifts in customer demand. That adaptability is worth far more than any single efficiency gain.
The manufacturers who outperform their peers in 2026 are not necessarily the ones with the leanest lines. They are the ones whose real-time production data gives them the visibility to make fast, confident decisions when conditions change. They have built optimisation into their operating model, not bolted it on as a project.
Strategic alignment is what separates lasting improvement from temporary gains. Optimisation efforts that connect directly to business objectives, whether that is customer lead time, product quality, or margin protection, tend to sustain themselves. Those driven purely by a cost target tend to stall once the easy wins are gone.
If you want your optimisation programme to last, anchor it to strategy from day one.
You now have a clear picture of what process optimisation means, which metrics to track, and where to begin. The next step is putting that knowledge into practice with the right tools and resources.
Mestric™ supports manufacturing leaders at every stage of this journey. From understanding MES vs traditional manufacturing approaches to taking concrete steps to streamline production operations, our platform and resources are built for executives who want results, not just reports. Explore our guides, case studies, and solution breakdowns to find the approach that fits your facility. When you are ready to see how connected equipment and real-time analytics work in practice, we offer onsite demonstrations tailored to your production environment.
Process optimisation aims to increase efficiency, reduce operational costs, and deliver higher product quality by continuously improving workflows. All three goals must be balanced, not pursued in isolation.
Key metrics include OEE, cycle time, process capability, KPIs, and quality performance indicators. Start with a small set and expand as your measurement capability matures.
AI and digital tools enable predictive maintenance, real-time optimisation, and greater flexibility, but require quality data and careful piloting to deliver reliable results.
Begin with pilot projects that tackle your most pressing bottleneck, involve your staff throughout, and use metrics to guide every change you make.


