


TL;DR:
- Many manufacturers operate at full capacity but lose 15–20% of potential output each month due to overlooked inefficiencies. Establishing clear KPI definitions, starting with five core metrics, and linking them to operational decisions enable sustained improvements and faster downtime reductions. Continuous review, data integrity, and ownership are essential for driving measurable performance gains through structured KPI analysis.
Many manufacturers are running at what feels like full capacity, yet 62% still lose 15–20% of potential output every single month. The cause is rarely a single dramatic failure. It is the accumulation of small, overlooked inefficiencies that compound shift after shift. This manufacturing KPI analysis guide is built for plant managers and operations analysts who want to stop guessing and start making decisions backed by data. You will learn how to prepare your data foundations, select the right metrics, execute your analysis, and build a system that drives real, measurable improvement.
| Point | Details |
|---|---|
| Define before you build | Agree on KPI definitions across teams before touching dashboards or data systems. |
| Start with five metrics | Limit your initial KPI set to five core metrics to avoid data overload and drive adoption. |
| Sequence matters | Following a definition, then data, then dashboard sequence can deliver a 30–50% downtime reduction within a year. |
| Decisions, not reports | Every KPI you track must link directly to an operational decision someone can act on. |
| Iterate continuously | Review and expand your KPI set regularly as operations mature and new patterns emerge. |
Before you run a single analysis, you need to do the work that most teams skip. Rushing into dashboards without solid foundations is one of the most common reasons KPI programmes fail within the first three months.
The first step is agreeing on what each metric actually means in your plant. OEE, for example, sounds universal, but its components (availability, performance, and quality) can be calculated in dozens of ways. If your operations team and your maintenance team are measuring downtime differently, your KPI data will never align. Defining terms like planned downtime, unplanned stoppages, and quality loss rates at the outset is non-negotiable.
Defining OEE and downtime metrics in the analytics layer before building dashboards significantly improves operator trust and adoption. This single step saves weeks of rework later.
Once definitions are agreed, check whether your data infrastructure can support them. A clean ERP-MES integration is the backbone of reliable KPI metrics for manufacturing. If your MES is not collecting machine-level data in real time, or if your ERP holds production order information that never syncs automatically, your reports will always lag behind the shop floor reality.
The table below outlines the key data inputs and what they support:
| Data source | What it enables |
|---|---|
| MES machine data | Real-time availability, cycle time, downtime classification |
| ERP production orders | Schedule adherence, throughput, cost per unit |
| Quality management system | Defect rates, first-pass yield, scrap volumes |
| Labour tracking system | Labour productivity, shift utilisation, overtime analysis |
Starting with no more than five metrics, one from each core category, prevents data overload and drives adoption far more effectively than launching with 30 KPIs at once. The five core categories to cover are efficiency, scheduling, quality, inventory, and cost.
Align your operations, maintenance, and finance teams on these initial metrics before going live. Each team should understand what they are responsible for and what decisions they are expected to make when a metric moves outside its target range.
Strokovni nasvet: Hold a 90-minute cross-functional workshop to map each KPI to a specific decision owner and a specific action. If you cannot name both, remove the metric from your initial set.
With your foundations in place, you are ready to run the analysis itself. A phased approach works far better than trying to track everything at once.
Start with the metrics that tell you what is actually happening on your production floor:
These are your daily management board KPIs. They support immediate execution decisions rather than retrospective reviews, which means your team leaders can act on them the same day.
Once Phase 1 metrics are stable and trusted, layer in the following:
For a broader view of production KPI examples used by operations teams, Mestric covers best practices tailored to plant-floor realities.
Build your initial dashboard around your five core metrics only. Resist the temptation to add more until each metric has been reviewed in at least three consecutive weekly operations meetings. At that point, you will have a clear picture of which additional metrics would genuinely inform decisions.
The comparison table below shows the difference between a reactive and a decision-led KPI dashboard approach:
| Approach | Focus | Outcome |
|---|---|---|
| Reactive dashboard | Reporting what happened last week | Late decisions, repeated problems |
| Decision-led dashboard | Real-time triggers for specific actions | Faster response, measurable improvement |
| Phased KPI rollout | Five core metrics expanding incrementally | Higher adoption, sustained engagement |
A phased KPI implementation that starts with foundational metrics before adding complexity avoids overwhelm and improves adoption rates across the team.
Strokovni nasvet: Set a visual threshold on each KPI, green, amber, and red, and define the exact action required at amber before the metric turns red. This turns your dashboard into a decision tool rather than a reporting tool.
Downtime analysis deserves its own focus. Classify every stoppage by category: planned maintenance, unplanned breakdown, changeover, material shortage, and operator-related. Then use a simple Pareto analysis to identify which category accounts for the most lost time. In most plants, two or three categories account for 80% of all downtime. Fix those first.
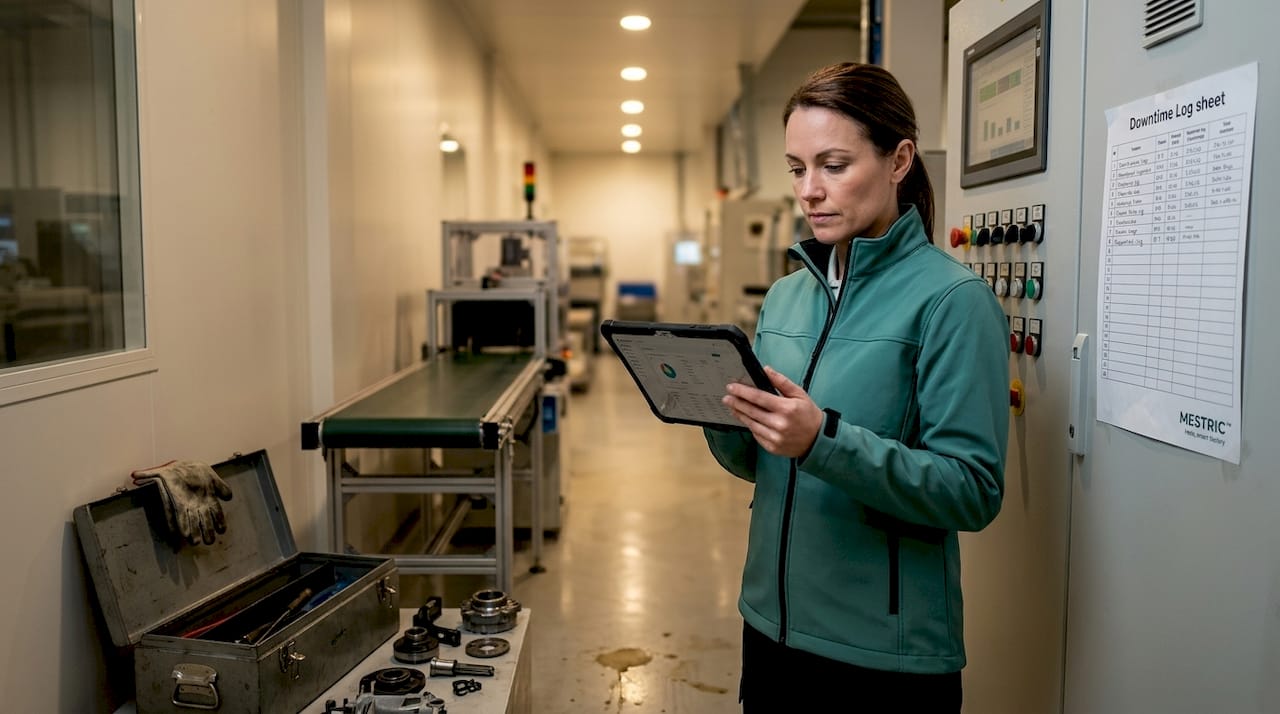
Even well-resourced teams make consistent errors when setting up their KPI programmes. Knowing these pitfalls in advance saves considerable time and frustration.
For teams working on transitioning to value-driven analytics, the shift from technology-first to decision-first thinking is the single most important change to make.
Analysis without verification is just reporting. You need a structured way to measure whether your KPI programme is delivering real operational gains.
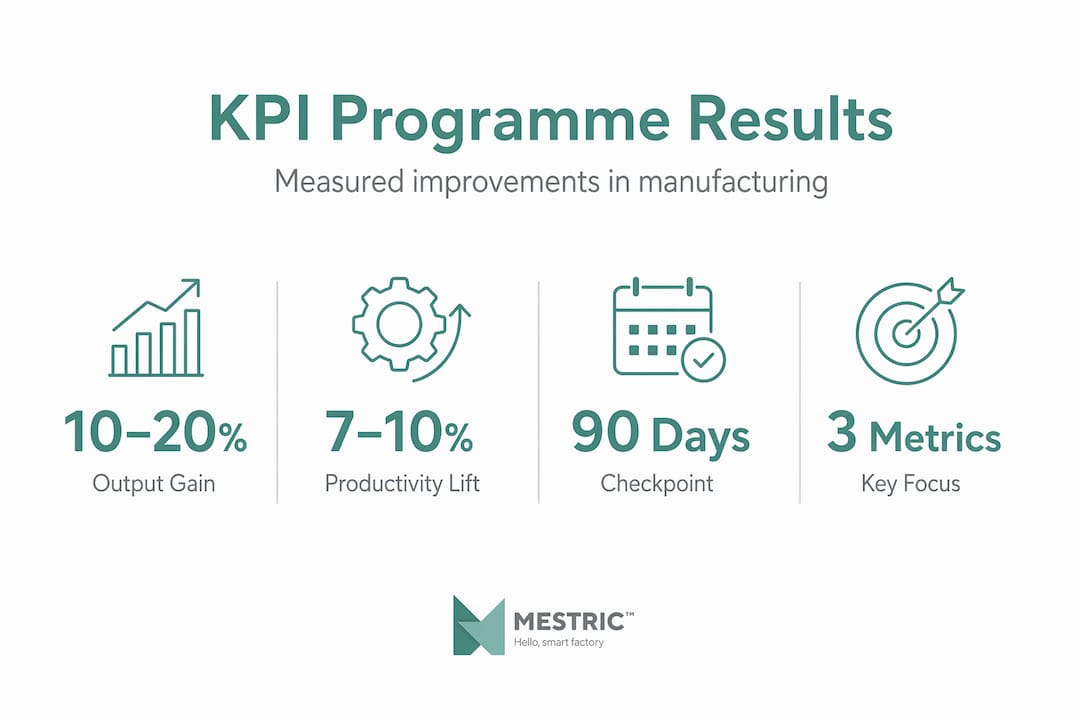
Smart manufacturing initiatives have produced average gains of 10–20% in production output and 7–10% in employee productivity, confirming that structured KPI programmes, supported by good data, deliver tangible results.
Strokovni nasvet: Set a 90-day checkpoint after launching your KPI programme. Compare your downtime, throughput, and schedule adherence figures against your baseline. If the numbers are not moving, the problem is usually in ownership, not data.
In my experience, the plants that struggle most with KPI analysis are not the ones with bad data or outdated systems. They are the ones that jumped straight to building dashboards before anyone agreed on what the numbers should mean.
I have seen teams spend months configuring beautiful reporting screens, only to find that the maintenance manager, operations supervisor, and finance analyst are all measuring OEE differently. The result is three different numbers, zero trust, and no decisions.
What I have learned is that the hard work is always in the alignment. Getting your key people into a room, agreeing on definitions, and deciding who acts when a metric moves. That conversation is unglamorous but it is the only foundation worth building on.
I would also push back on the idea that more KPIs mean better visibility. In my view, a plant running on five well-understood metrics outperforms one drowning in 40 half-monitored ones every time. The goal of any KPI programme is not to measure everything. The goal is to change the right decisions. If you can link every metric back to a specific decision that someone will make differently because of it, you are on the right path.
KPI analysis is not a project with an end date. It is an operating discipline. The plants that get the most from it treat it that way.
— Andraž
Running an effective KPI programme at scale requires more than spreadsheets and manual data pulls. Mestric’s Manufacturing Execution System connects directly with your production equipment to deliver real-time KPI tracking across performance, downtime, quality, and cost, all in one place.

Whether you are building your first KPI dashboard or expanding an existing programme, Mestric gives you the data quality and visibility your team needs to act fast. The platform integrates with your existing ERP to eliminate the data gaps that undermine trust in your numbers. If you want to see how a modern MES platform compares with traditional manufacturing methods, Mestric’s onsite demonstration shows exactly how connected machinery transforms plant-floor decision-making in practice.
Production KPIs are measurable values that track the performance of your manufacturing operations, covering efficiency, quality, output, scheduling, and cost. Common examples include OEE, throughput rate, schedule adherence, defect rate, and labour productivity.
Start with no more than five KPIs, one from each core category. Tracking too many metrics at once reduces focus and hinders adoption. Expand your KPI set incrementally once your initial metrics are well understood and consistently reviewed.
OEE (Overall Equipment Effectiveness) measures the combined impact of availability, performance, and quality on your production output. It is one of the most widely used KPI metrics for manufacturing because it reveals the true productive capacity of your equipment in a single figure.
Effective analysis starts with agreed definitions, clean data, and a small set of decision-linked metrics. Review KPIs in daily and weekly operations meetings, assign clear ownership for each metric, and use Pareto analysis to prioritise the biggest sources of loss.
Manufacturers who follow the correct sequence of definition, data, and dashboards typically see a 30–50% reduction in downtime and a 10–15% improvement in labour productivity within twelve months, provided that KPI reviews are integrated into regular operational decision-making.


 069 763 552