

Many manufacturing executives still view analytics as a complex, unreliable technology reserved for tech giants. Yet recent research reveals that non-invasive power data analytics classifies machine states with less than 2% error in production count. This precision transforms how you monitor equipment, predict failures, and optimise workflows. Analytics is no longer optional for competitive manufacturing. It’s the foundation for smarter decisions, reduced downtime, and measurable efficiency gains. This article clarifies what analytics means in your factory, explores seven proven application areas, and provides a practical roadmap for deployment.
| Point | Details |
|---|---|
| Precision impact | Analytics delivers production insights with less than 2% error in key operations. |
| Seven application areas | Analytics improves manufacturing across maintenance, quality, supply chain, and more. |
| Right-fit architecture | Combining edge and cloud analytics maximises both speed and depth in decisions. |
| Critical asset focus | Start with your most crucial lines or machines to drive measurable improvement. |
| Continuous adoption | Iterate and refine analytics deployments for sustained efficiency gains. |
Analytics in manufacturing refers to the systematic examination of production data to improve operations, quality, and decision-making. It transforms raw machine signals, sensor readings, and process logs into actionable insights. You’re already collecting this data through equipment controllers, quality sensors, and production logs. Analytics turns that information into answers.
Four types of analytics serve distinct purposes in your facility:
Advanced analytics maps seven application areas in manufacturing with suitable techniques for each. These applications range from predictive maintenance to energy management, each addressing specific operational challenges. Understanding the role of data in manufacturing helps you prioritise which analytics capabilities deliver the fastest return.
Typical data sources include programmable logic controllers, supervisory control systems, quality inspection stations, and enterprise resource planning systems. Modern manufacturing execution systems connect these sources, creating a unified view of production performance. Knowing the types of manufacturing metrics you can track ensures you focus analytics efforts on the KPIs that matter most.
Research identifies seven core areas where analytics delivers measurable value in factory environments. Each area addresses specific operational challenges and uses distinct analytical techniques.
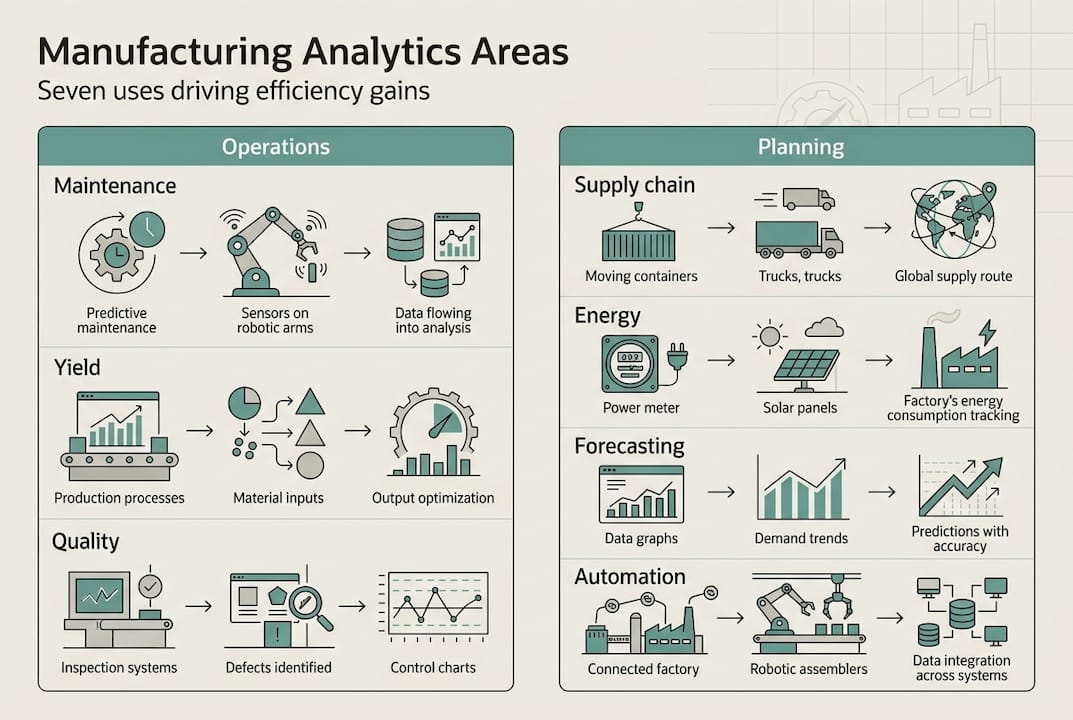
Predictive maintenance analyses equipment sensor data to forecast failures before they occur. This approach reduces unplanned downtime by 30 to 50% compared to reactive maintenance. Machine learning algorithms detect subtle patterns in vibration, temperature, and power consumption that signal impending failures.
Yield optimisation examines process parameters to maximise output quality and quantity. Statistical process control and regression analysis identify the ideal settings for temperature, pressure, speed, and material inputs. Small improvements in yield translate directly to profitability.
Quality control uses real-time analytics to detect defects during production rather than after completion. Computer vision and pattern recognition spot anomalies instantly, enabling immediate corrective action. This prevents entire batches from becoming scrap.
Supply chain optimisation applies analytics to inventory levels, supplier performance, and logistics. Predictive models balance stock availability against carrying costs, whilst diagnostic analytics identify bottlenecks in material flow.
Energy management monitors power consumption across equipment and processes. Analytics pinpoint energy waste, suggest efficiency improvements, and track progress towards sustainability targets. Factories typically reduce energy costs by 10 to 20% through targeted interventions.
Demand forecasting combines historical sales data with external factors to predict future orders. Accurate forecasts enable better production planning, reducing both stockouts and excess inventory.
Process automation uses prescriptive analytics to adjust production parameters automatically. Closed-loop systems respond to changing conditions without human intervention, maintaining optimal performance continuously.
The table below matches each application area to its most effective analytical techniques:
| Application area | Primary analytics technique | Key benefit |
|---|---|---|
| Predictive maintenance | Machine learning, anomaly detection | Reduced unplanned downtime |
| Yield optimisation | Regression analysis, design of experiments | Higher output quality |
| Quality control | Computer vision, statistical process control | Real-time defect detection |
| Supply chain optimisation | Simulation, optimisation algorithms | Lower inventory costs |
| Energy management | Time-series analysis, benchmarking | Reduced energy consumption |
| Demand forecasting | Time-series forecasting, regression | Better production planning |
| Process automation | Prescriptive analytics, control algorithms | Consistent optimal performance |
These applications aren’t theoretical. Advanced analytics maps seven application areas with proven techniques that factories deploy today. Understanding your manufacturing efficiency workflow helps you select the right starting point. For deeper implementation guidance, review this production optimisation guide or explore power data analytics research for technical details.
Scepticism about analytics accuracy is common, but recent research provides concrete performance data. Non-invasive power data analytics classifies machine states with less than 2% error in production count. This precision level makes analytics reliable enough for critical operational decisions.
What does 2% error mean in practice? Consider a production line running 10,000 units daily. Traditional manual counting might miss 200 to 500 units due to human error or visibility gaps. Analytics-based monitoring misses fewer than 20 units. This accuracy enables precise yield calculations, accurate cost accounting, and reliable performance metrics.
The business implications extend beyond counting:
| Metric | Impact of high-accuracy analytics |
|---|---|
| Downtime detection | Identifies stops within seconds, not hours |
| Quality tracking | Catches defects before they propagate |
| Resource utilisation | Reveals true equipment effectiveness |
| Cost allocation | Assigns expenses to specific products accurately |
| Decision confidence | Provides reliable data for strategic choices |
High accuracy reduces operational risk. When you trust your data, you can respond faster to problems, optimise more aggressively, and invest with confidence. Factories using precise analytics report 15 to 25% improvements in overall equipment effectiveness within the first year.
Pro Tip: Focus on actionable metrics that drive specific improvements rather than tracking everything possible. Three well-chosen KPIs with high accuracy outperform ten mediocre measurements. Start with metrics directly tied to your biggest operational challenge, whether that’s downtime, quality, or throughput.
The shift from reactive to predictive operations represents the most significant benefit. Instead of responding to failures, you prevent them. Instead of inspecting quality after production, you control it during production. This fundamental change in operational rhythm delivers step-change improvements, not incremental gains. Learn more about manufacturing process improvement to apply these principles in your facility.
Where you process analytics matters as much as what you analyse. Three architectures serve different manufacturing needs: edge analytics, cloud analytics, and hybrid approaches.
Edge analytics processes data directly on factory equipment or local servers. This architecture delivers instant results with minimal latency, making it ideal for real-time quality inspection, immediate process adjustments, and safety-critical applications. Edge systems work even when internet connectivity fails, ensuring continuous operation.
Cloud analytics sends data to remote servers for processing. This approach handles massive datasets, complex machine learning models, and long-term trend analysis. Cloud platforms offer virtually unlimited computing power and storage, enabling sophisticated analytics that would overwhelm local systems.
Hybrid analytics combines both approaches strategically. Critical, time-sensitive decisions happen at the edge. Heavy computation, model training, and historical analysis occur in the cloud. This architecture optimises both performance and cost.
Experts recommend nuanced deployment strategies. Edge AI suits low-latency applications like quality inspection, whilst cloud handles model training. A hybrid hierarchy aligned with ISA-95 standards provides the best balance. The key insight: prioritise critical assets rather than deploying analytics everywhere simultaneously.
The table below compares these architectures:
| Architecture | Best for | Limitations |
|---|---|---|
| Edge | Real-time decisions, quality inspection, safety systems | Limited computing power, harder to update |
| Cloud | Model training, historical analysis, complex algorithms | Requires connectivity, higher latency |
| Hybrid | Most manufacturing scenarios | More complex to design and maintain |
Pro Tip: Start with edge analytics for your most critical production line, then expand to cloud-based analysis as you accumulate historical data. This phased approach builds capability without overwhelming your team or budget.
“The future of manufacturing analytics isn’t purely edge or purely cloud. It’s intelligent distribution of processing based on each application’s specific requirements. Critical assets get edge priority, whilst cloud handles the heavy lifting.”
Understanding the role of AI in manufacturing clarifies which architecture suits your needs. For practical implementation steps, explore optimising production workflow with AI. Additional context on analytics in manufacturing best practices helps you avoid common pitfalls.
Successful analytics deployment follows a structured approach. These steps ensure you deliver measurable value whilst avoiding common pitfalls.
Common pitfalls derail even well-intentioned projects. Overcomplicating the initial deployment with too many features or data sources creates confusion and delays. Poor data governance leads to unreliable results that erode trust. Lack of operator buy-in means insights never translate into action. Starting with technology rather than a business problem produces impressive dashboards that don’t improve performance.
Prioritising critical assets rather than blanket deployment concentrates resources where they matter most. Advanced analytics maps seven application areas with suitable techniques, helping you match solutions to problems systematically.
Ongoing improvement requires measurement and iteration. Track both technical metrics (accuracy, uptime, data quality) and business outcomes (reduced downtime, improved yield, lower costs). Review results monthly, adjust algorithms and thresholds, and expand capabilities based on proven success.
Pro Tip: Involve line operators from day one. They understand the process nuances that data alone can’t reveal, and their buy-in determines whether insights become action. Schedule weekly reviews where operators share what they’ve learned from analytics outputs.
“The best analytics projects start with a clear business challenge, not a technology mandate. Define the problem you’re solving, then select the analytics approach that addresses it most effectively.”
For comprehensive guidance on implementation, review improving efficiency with MES, which covers the systems that enable effective analytics deployment.
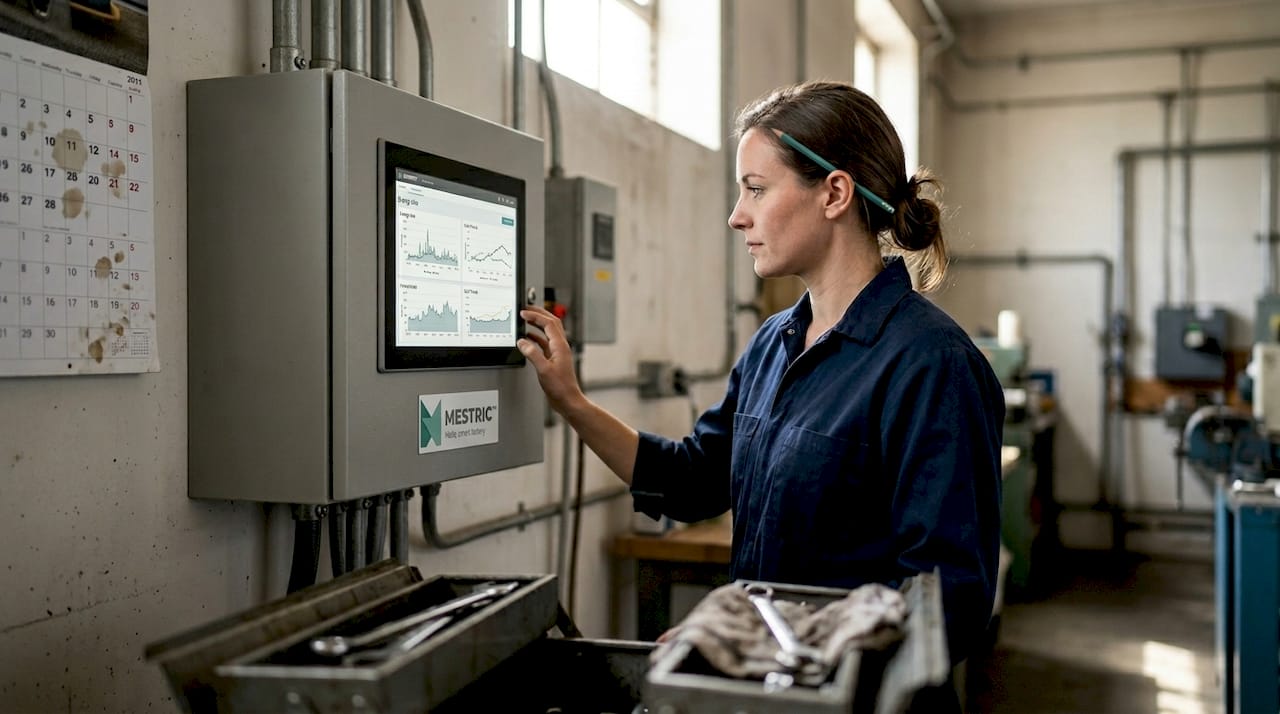
Transforming analytics knowledge into operational improvements requires the right tools and support. Modern manufacturing execution systems integrate analytics capabilities directly into production workflows, making insights accessible to everyone who needs them.
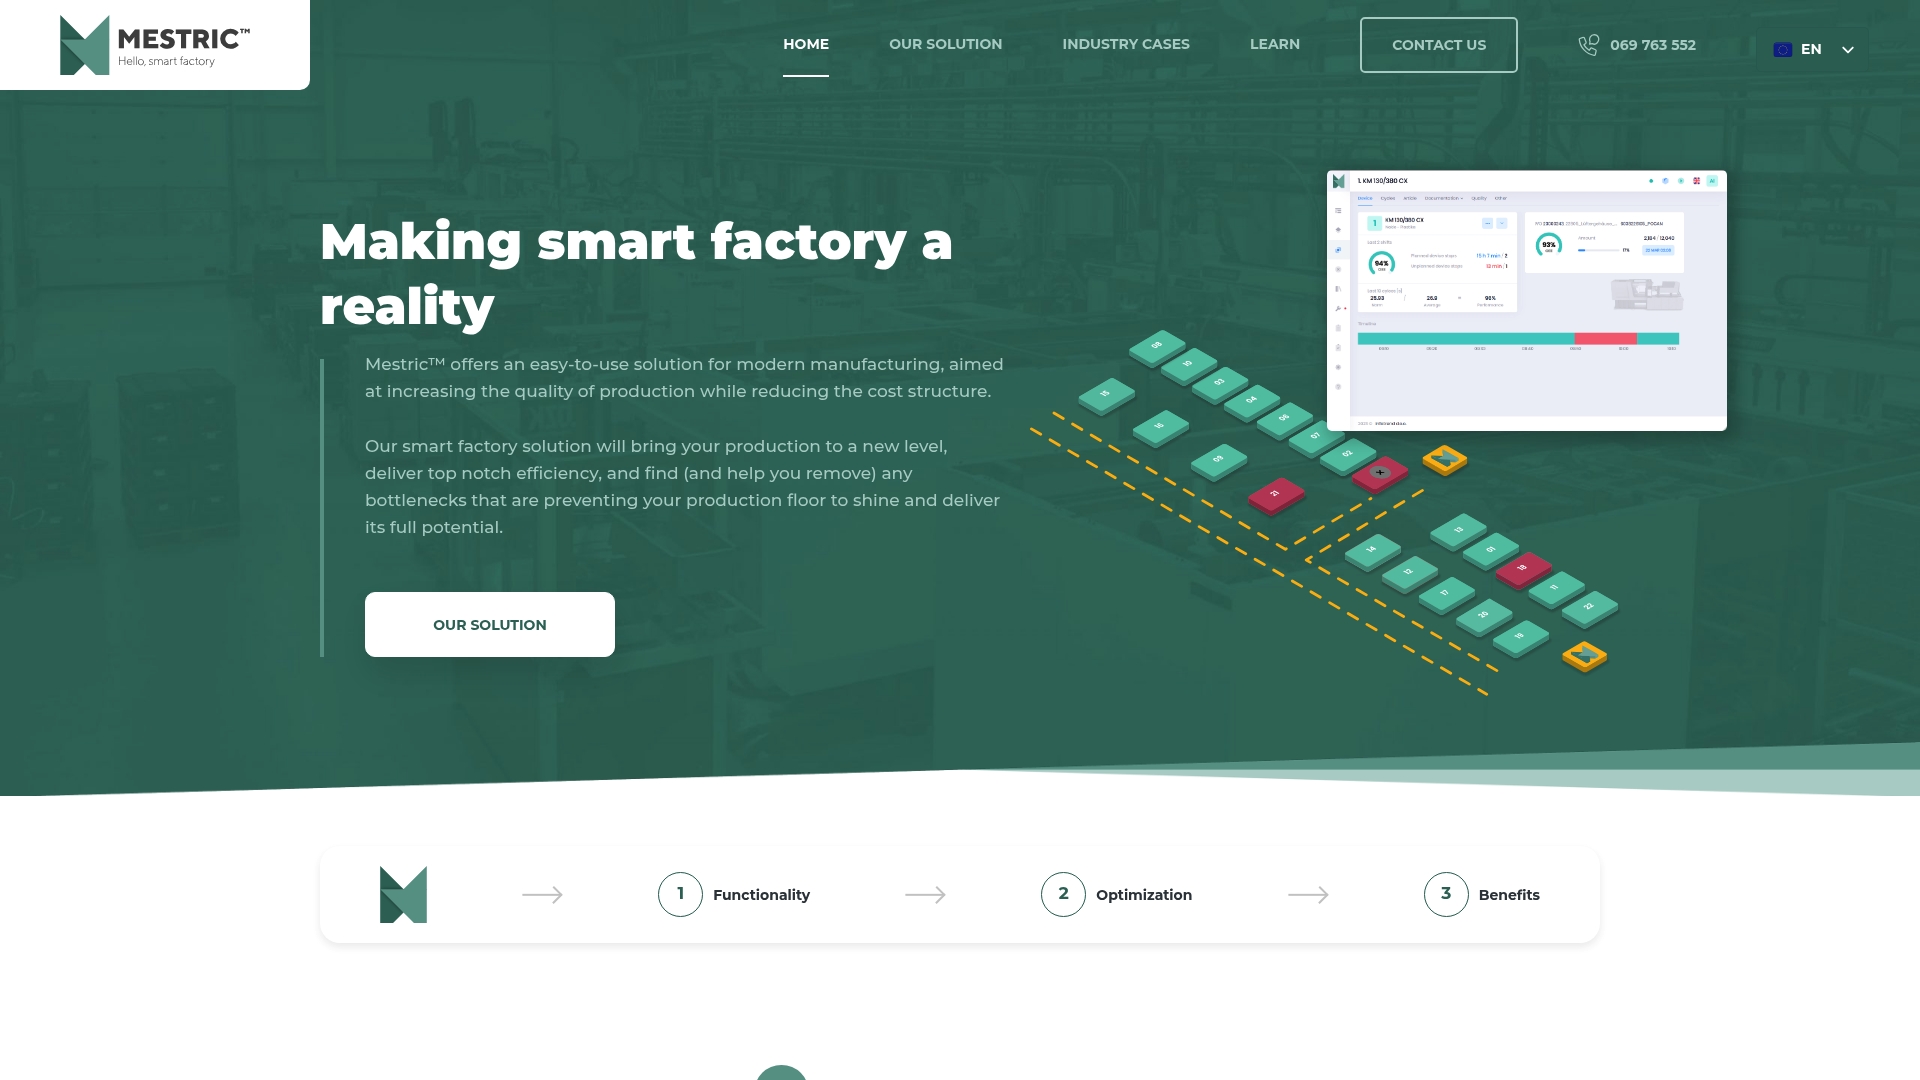
Mestric™ connects directly with your manufacturing equipment, providing real-time performance tracking, quality monitoring, and productivity analytics. The platform combines descriptive, diagnostic, and predictive analytics in a single interface, eliminating the complexity of managing multiple systems. You see KPIs such as performance metrics, downtime patterns, quality parameters, and cost analysis without manual data collection.
AI-powered optimisation tools identify bottlenecks, suggest process improvements, and track the impact of changes you implement. This closed-loop approach ensures analytics drives continuous improvement rather than generating reports that sit unread. The system scales from a single production line to enterprise-wide deployment, growing with your analytics maturity.
For executives evaluating analytics platforms, understanding MES vs traditional manufacturing clarifies the advantages of integrated systems. Exploring the types of manufacturing software helps you assess how analytics fits within your broader technology strategy. Practical guidance on how to streamline production operations demonstrates the operational changes that maximise analytics value.
Processes with high variability, repetitive tasks, or complex supply chains benefit most, such as assembly lines and quality inspection. Advanced analytics maps seven application areas in manufacturing with suitable techniques for each.
Recent research shows analytics can classify machine states with less than 2% error, enabling reliable monitoring and optimisation. This precision supports confident operational decisions.
Edge analytics runs on-site for instant decisions, whilst cloud analytics processes large datasets for deeper insights. Hybrid solutions combine both advantages, with edge handling low-latency applications and cloud managing model training.
Begin by identifying your most critical process or asset, define success metrics, pilot a small project, and scale only after measurable results. Prioritise critical assets rather than deploying analytics everywhere simultaneously.


