


Predictive maintenance is condition-based maintenance that uses sensors and analytics to spot early signs of failure and schedule repairs before a breakdown happens. The main payoff is fewer unplanned stoppages and a measurable lift in overall equipment effectiveness (OEE). It works best on critical, high-cost or 24/7 assets, and most plants run it alongside preventive maintenance rather than replacing it outright.
TL;DR:
- Sensors must be properly installed and calibrated to avoid false alerts that erode maintenance trust and reduce system reliability.
- A successful pilot typically involves choosing critical assets, defining clear success metrics, and collecting several weeks of baseline data.
- Predictive maintenance yields an average of 18% to 31% cost reduction but results vary based on industry, asset, and implementation discipline.
- Connecting predictive maintenance alerts to a manufacturing execution system ensures timely, data-driven work orders and minimizes false alarms affecting production.
- Achieving buy-in requires starting small, demonstrating tangible improvements within six to twelve weeks, and involving technicians early in defining success criteria.
Predictive maintenance (PdM) works from live condition data rather than a fixed clock. Sensors monitor an asset continuously and feed that data into analytics that flag deterioration before it turns into failure, letting you intervene at the right moment rather than the scheduled one, according to IBM’s definition of predictive maintenance.
Preventive maintenance takes a different route: it services equipment on a time or usage interval, whether or not it needs it. Reactive maintenance, the oldest model, just waits for something to break. Napovedno vzdrževanje sits between the two and aims to spend money on repairs only when the equipment’s own condition says so.
Signals typically map to specific failure modes:
Not every asset deserves this treatment. Low-cost, easily replaceable parts usually stay on a preventive schedule because the sensor investment would never pay back. A hybrid approach, PdM on your critical bottlenecks and preventive on everything else, is how most mature plants actually run.
The commercial case rests on three cost buckets: downtime, spare parts, and emergency labour. Unplanned stoppages are expensive not just in lost output but in overtime call-outs and rushed part orders at premium prices. PdM attacks all three by giving maintenance teams weeks of warning instead of minutes.
Reported cost reductions from predictive maintenance programmes range from roughly 18% to 31%, alongside measurable OEE gains, according to ifm’s analysis of PdM benefits. Actual results vary widely by industry, asset type and how disciplined the implementation is.
The National Institute of Standards and Technology notes that advanced maintenance techniques can produce high returns, but warns that national-level benchmarks are limited and firm-level results swing considerably. Treat any percentage you read, including the ranges above, as a directional guide rather than a guarantee for your specific line.
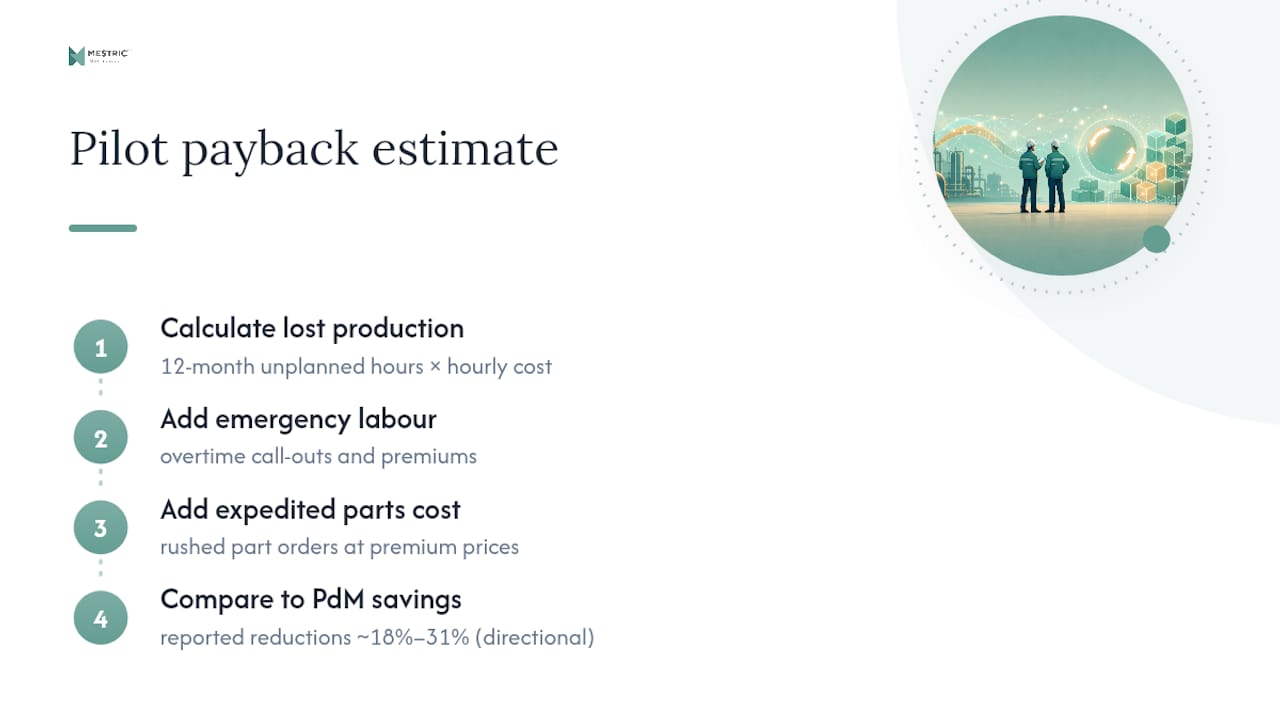
To build a simple payback estimate for a pilot, tally your last twelve months of unplanned downtime hours on the target asset, multiply by your hourly cost of lost production, then add emergency labour premiums and expedited parts costs. That baseline is what your pilot needs to beat. Tools like the analytics covered in predictive analytics for manufacturing can help structure that comparison once you have live data flowing.
A working PdM system combines sensing hardware, a data pipeline and an analytics layer that turns readings into an alert. AWS describes the model as IoT sensors, machine learning and business data working together to predict failures and slot maintenance into the production schedule at the least disruptive moment.
The sensor layer typically includes:
Edge analytics process data close to the machine, useful for high-frequency vibration readings that would swamp a network if sent raw. Cloud analytics handle the heavier modelling and cross-asset comparisons, feeding results into your CMMS or MES so a flagged anomaly becomes a work order automatically. None of this works without solid baselines: accurate timestamping, consistent sampling rates and clean equipment metadata (asset ID, install date, criticality rating) are what let a model tell “normal” from “trending toward failure.”
A pilot-first rollout keeps risk low and gives you real evidence before you ask for a wider budget. Vendor guides and industry practice consistently point to the same starting principle: pick a small, well-defined scope and prove the model before scaling.
Assign clear ownership early: one engineer or team should own model tuning, and maintenance planners need to know precisely what an alert means for their schedule. Roll out asset by asset rather than plant-wide, so lessons from the pilot inform the next batch instead of being learned twice.
Strokovni nasvet: Run your pilot on an asset that already has a documented failure history. Comparing the model’s predictions against past incidents gives you a fast, credible way to validate accuracy before wider rollout.
Most PdM disappointments trace back to data, not algorithms. Poor sensor mounting, inconsistent sampling rates and electrical noise in the plant environment are the most common causes of false alerts, and they erode trust fast, according to Forbes’ review of predictive maintenance data quality.
A sensor bolted on loosely, or sampling at the wrong rate, produces noise that looks exactly like an early failure signal to an untrained model. Get the physical installation right first; the analytics layer can only be as good as what it is fed.
Model reliability depends on a proper baseline, labelled examples of past failures to train against, and a retraining schedule that catches drift as equipment ages or operating conditions change. Sensor pipelines described in research on learning-based maintenance strategies typically run anomaly detection, fault diagnosis and remaining-life estimation as separate stages, each needing its own validation.
Strokovni nasvet: Keep a human in the loop on every early alert. A maintenance planner confirming the first fifty alerts against physical inspection will tell you more about your false-alarm rate than any dashboard.

Track OEE, mean time between failures (MTBF), mean time to repair (MTTR) and your false-alarm rate, and report them monthly against your pilot baseline so stakeholders see the trend, not just a snapshot.
Planned interventions carry a real safety upside. Fixing a failing bearing on your schedule, under proper lockout/tagout, is safer than responding to a sudden catastrophic failure, a point Megger’s review of predictive maintenance benefits makes directly. Teams also need new skills: reading sensor dashboards, interpreting model confidence scores, and coordinating spare-part orders around predicted failure windows rather than fixed stock levels. A manufacturing safety management platform can help formalise how planned interventions reduce workplace hazard exposure.
Every PdM programme that works started small. Pick one asset class, prove an OEE or MTTR improvement inside six to twelve weeks, and use that evidence to fund the next phase. Trying to instrument the whole plant at once is the single most common way to burn budget and credibility simultaneously.
The real blockers are rarely technical. Data trust breaks down when the first few alerts turn out to be false positives. ROI criteria left vague invite endless debate after the pilot ends. And maintenance technicians who have run on gut feel for twenty years will resist a dashboard telling them when to act, unless they were involved in defining what “working” looks like from day one.
— Andraž
Predictive maintenance alerts only create value once they connect to what production actually does with them. A manufacturing execution system is the layer that ties a sensor-driven alert to a real work order, a machine’s live performance data, and the downtime cost it would have caused if ignored.

The platform connects directly with shop floor equipment, consolidating performance metrics, downtime events and quality parameters in one view alongside maintenance signals rather than in separate tools. That matters because a false alarm caught early against real production KPIs costs you nothing, while one buried in a maintenance-only tool can sit unresolved for days. AI-powered optimisation tools help surface which bottlenecks are actually costing output, providing a clearer before-and-after picture than downtime logs alone. If you are comparing platforms for this kind of integration, MES versus traditional manufacturing approaches is worth reading before you commit. Book an onsite demonstration to see how connected machinery data would look on your own production lines.
For deeper technical grounding beyond this guide, these sources cover the standards, research and practical detail that inform current PdM practice:


 069 763 552