


TL;DR:
- Overall Equipment Effectiveness measures manufacturing productivity by combining availability, performance, and quality into a single percentage. Improving OEE through automation and structured analysis can significantly increase output, reduce costs, and boost profitability. Framing OEE as a financial lever encourages leadership support and fosters cross-functional accountability for continuous improvement.
Overall Equipment Effectiveness (OEE) is the standard metric for measuring how productively manufacturing equipment is used, combining availability, performance, and quality into a single percentage score. Formalised under ISO 22400-2:2014, OEE gives plant managers and production supervisors a clear, quantifiable view of where productive time is being lost. World-class OEE benchmarks sit at 85% or above for discrete manufacturing and 90% or above for continuous process industries, yet most plants without automated tracking score between 40% and 65% once measurement becomes rigorous. Understanding the role of OEE in manufacturing is the first step towards closing that gap.
OEE is calculated using the formula: OEE = Availability × Performance × Quality. Each factor isolates a distinct category of production loss, making it straightforward to pinpoint where time and output are being wasted.

Availability measures the proportion of planned production time that equipment is actually running. It captures losses from unplanned breakdowns, planned maintenance, and changeover or setup time. The formula is: Availability = Run Time / Planned Production Time.
Performance reflects how fast the equipment runs relative to its theoretical maximum speed. Minor stops, slow cycles, and operator inefficiencies all reduce this figure. The formula is: Performance = Actual Output / (Run Time × Ideal Run Rate).
Quality captures the proportion of output that meets specification on the first pass. Defects, rework, and startup scrap all reduce the quality score. The formula is: Quality = Good Parts / Total Parts Produced.
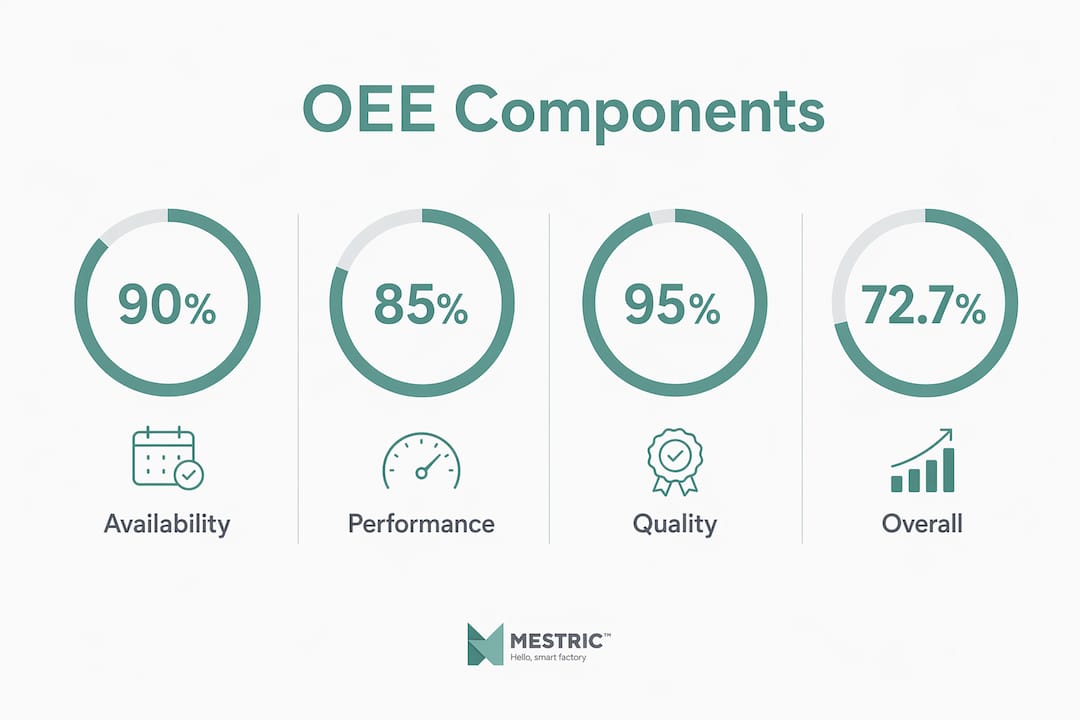
| OEE component | Example value | What it means |
|---|---|---|
| Availability | 90% | Equipment ran for 90% of planned production time |
| Performance | 85% | Equipment ran at 85% of its theoretical speed |
| Quality | 95% | 95% of parts produced met specification first time |
| OEE score | 72.7% | Overall productive use of the equipment |
Multiply those three figures together: 0.90 × 0.85 × 0.95 = 0.727, giving an OEE of 72.7%. That score sits within the typical real-world range but falls short of the 85% world-class benchmark, which tells you there is meaningful room to improve.
Pro Tip: Calculate each component separately before combining them. A low OEE score on its own tells you something is wrong. Knowing whether availability, performance, or quality is the weakest link tells you exactly where to act.
OEE improvement is not just an operational goal. It is a direct financial lever. A 10-point OEE improvement can generate £4M–£8M in annual revenue capacity or cost avoidance for a typical £40M manufacturing plant, with each single percentage point worth roughly £400K–£800K in financial benefit.
“The same OEE mathematics framed as a £5M annual lever changes leadership perceptions entirely. Operational metrics stay on the shop floor. Financial metrics reach the boardroom.”
That distinction matters enormously for plant managers seeking budget approval for improvement programmes. When you present OEE as a financial metric rather than a production score, executive engagement follows. The OEE impact on productivity is visible in reduced waste, lower energy consumption per unit, and fewer quality escapes reaching customers.
Typical real-world OEE for plants without automated tracking sits between 40% and 65%. Plants that invest in measurement infrastructure and structured improvement programmes regularly reach 75%–80% within 12–18 months. That trajectory represents a compounding financial return, not a one-off gain.
The financial case also extends to competitive positioning. A plant running at 80% OEE can produce the same volume as a competitor running at 65% OEE with significantly less capital expenditure on new equipment. Capacity created through OEE improvement costs a fraction of capacity created through capital investment.
OEE is most powerful when used alongside the Six Big Losses framework, which maps every production loss to one of the three OEE components. Equipment failures and setup losses reduce availability. Idling and reduced speed reduce performance. Process defects and startup losses reduce quality. This mapping converts a single percentage score into a structured root-cause analysis tool.
OEE serves as both a diagnostic and validation tool, allowing teams to identify specific loss categories and then verify whether corrective actions have worked, often within a few weeks of implementation. That feedback loop is what separates OEE from passive reporting metrics.
A practical continuous improvement cycle using OEE looks like this:
Treating OEE without the Six Big Losses framework often leads to metric fatigue, where teams track the number but make no progressive gains because they lack a structured method for acting on it.
OEE also creates a common language across maintenance, operations, and quality teams. Availability issues relate primarily to maintenance, performance issues to operations, and quality issues involve shared accountability. That clarity reduces departmental blame and focuses every team on the same goal.
Pro Tip: Use OEE trend data, not just point-in-time scores. A plant moving from 62% to 68% OEE over six months is making genuine progress, even if it has not yet reached world-class levels. Trend direction is as informative as the absolute number.
The most common obstacle to accurate OEE measurement is manual data collection. Manufacturers using manual tracking often record OEE between 40% and 60% because operators miss micro-stops, transient speed losses, and subtle quality issues that automated systems capture automatically. The gap between perceived and actual performance can be substantial.
Key challenges and how to address them:
Best practice is to deploy automated real-time OEE measurement infrastructure before layering improvement programmes on top. Manual or non-real-time approaches generate short-lived gains. Automation creates the compounding improvement that justifies the investment.
Pro Tip: Before launching any OEE improvement programme, audit your data collection method. If operators are entering stop times manually at the end of a shift, your OEE baseline is almost certainly understated. Fix the measurement first, then improve the process.
OEE is the single most effective metric for connecting equipment performance to financial outcomes, and its value depends entirely on how rigorously it is measured and acted upon.
| Point | Details |
|---|---|
| OEE formula | Multiply availability, performance, and quality to get a single productivity score. |
| World-class benchmark | Aim for 85% or above in discrete manufacturing; most plants start between 40% and 65%. |
| Financial value | Each one-point OEE gain is worth roughly £400K–£800K annually for a mid-size plant. |
| Six Big Losses | Map every loss to its OEE component before selecting an improvement action. |
| Measurement first | Automate data collection before starting improvement programmes to sustain long-term gains. |
I have seen OEE deployed in two very different ways across manufacturing plants, and the difference in outcomes is stark. In the first scenario, OEE lives on a screen in the production office. Operators know the number. Supervisors report it weekly. Nothing changes because no one with budget authority sees it as their problem. In the second scenario, OEE is presented to the leadership team as a financial figure. A plant running at 68% OEE has roughly 17 percentage points of untapped capacity before it reaches world-class performance. At £500K per point, that is an £8.5M opportunity sitting idle. That framing changes the conversation entirely.
Framing OEE as a revenue lever rather than an operational score is the single most effective way to secure the investment needed for proper measurement infrastructure and structured improvement programmes. Plant managers who present OEE in financial terms get budgets approved. Those who present it as a production percentage often do not.
The cultural dimension is equally important. OEE only delivers sustained improvement when maintenance, operations, and quality teams share the same data and accept shared accountability for the result. I have watched cross-functional OEE reviews transform adversarial departments into collaborative ones, simply because the metric made it clear who owned which losses. That clarity is worth as much as any technical tool.
With Industry 4.0 and connected manufacturing becoming standard, the opportunity to measure OEE accurately and act on it quickly has never been greater. The advanced manufacturing metrics available through modern MES platforms make the manual tracking era look like guesswork by comparison. If your plant is still relying on paper logs or end-of-shift data entry, the measurement gap is your most urgent problem to solve.
— Andraž
Mestric’s Manufacturing Execution System connects directly to your production equipment, capturing availability, performance, and quality data automatically and in real time. That means your OEE scores reflect what is actually happening on the line, not what operators recorded at the end of a shift.

Mestric presents OEE metrics through live dashboards that are visible to production supervisors, maintenance teams, and plant managers simultaneously. Every loss event is logged, categorised, and available for root-cause analysis without manual data entry. For plant managers ready to move from manual tracking to a fully connected measurement environment, MES versus traditional manufacturing is a practical starting point for understanding what that shift delivers. You can also request an onsite demonstration to see how Mestric connects to your specific equipment and surfaces the OEE data your team needs.
OEE stands for Overall Equipment Effectiveness. It is a composite metric that multiplies availability, performance, and quality to express how productively a piece of equipment is being used as a single percentage score.
World-class OEE is 85% or above for discrete manufacturing and 90% or above for continuous process industries. Most plants without automated tracking score between 40% and 65%.
OEE equals Availability multiplied by Performance multiplied by Quality, with each component expressed as a decimal. For example, 0.90 × 0.85 × 0.95 gives an OEE of 72.7%.
OEE identifies exactly which category of loss, whether availability, performance, or quality, is reducing output. That specificity allows teams to target improvement actions precisely rather than applying generic fixes across the whole production process.
Automated tracking captures micro-stops and transient losses that manual recording misses entirely. Plants switching from manual to automated measurement typically discover their true OEE is lower than reported, which reveals hidden improvement opportunities.


 069 763 552