


TL;DR:
- Combining early process inspection, SPC, structured continuous improvement, and digital data enables the fastest yield gains.
- Focusing on controlling materials, recipes, and real-time data with MES accelerates root-cause analysis and sustains improvements.
The fastest, most reliable yield gains come from combining four tactics: start-of-line inspection, statistical process control (SPC), structured continuous improvement (CI) projects, and digital data capture via a Manufacturing Execution System (MES). In electronics, adding solder-paste inspection (SPI) before reflow routinely lifts first-pass yield (FPY); in food manufacturing, locking recipes and tightening incoming-material acceptance criteria cuts rework at source. Pick one line, measure your current FPY and scrap rate this week, and you have a baseline to build on.
Key examples of yield improvement strategies by sector:
Industry data suggests that combining SPC, root-cause analysis, and AI-enabled prediction can unlock 20–30% yield improvement potential for manufacturers who connect data, processes, and skills.
Yield improvement falls into six practical categories. Each has a different lead time, resource demand, and best-fit sector.
| Category | Typical lead time to results | Resource intensity | Best-fit sector |
|---|---|---|---|
| Process control & inspection | 2–6 weeks | Low–medium | Electronics, pharma, food |
| Materials / recipe management | 4–8 weeks | Medium | Food, batch process, chemicals |
| Continuous improvement (CI) | 6–16 weeks | Medium–high | All sectors |
| Equipment & maintenance (TPM) | 8 weeks | Medium–high | Discrete, automotive, FMCG |
| Digital tools / MES | 4–12 weeks (pilot) | Medium | All sectors |
| People & standard work | 1–4 weeks | Low | All sectors |
How to choose: if your scrap rate is high and variable, start with process control and inspection. If raw-material variation is the dominant cause of rework, move to materials management first. Equipment-driven defects point to TPM and Cpk work. Data blind spots, where you cannot explain why yield varies, call for a digital or MES intervention. Standard work and training are low-cost quick wins that complement every other category.
Measuring earlier in the process is one of the highest-return yield optimization techniques available. The logic is straightforward: a defect caught at the printing stage costs a fraction of one found after reflow or final test.
In electronics assembly, controlling solder-paste height and volume before reflow is particularly effective because a significant proportion of soldering defects originate at the printing stage. SPI equipment measures paste height, area, and volume on every board; AOI downstream catches component placement errors before the oven. Together, they give you two containment points rather than one end-of-line screen.
Implementation checklist for start-of-line inspection:
SPC essentials:
Profi tipp: Before investing in automated SPI equipment, use a manual paste-height gauge and a simple spreadsheet control chart. Even a two-week manual dataset will tell you whether paste variation is your primary defect driver, saving you from buying equipment that solves the wrong problem.
Raw-material variation is one of the most underestimated sources of yield loss in food and batch manufacturing, where effective ambient dust control for manufacturing plants can make a significant difference. A 2% shift in moisture content in an incoming flour batch can move a biscuit line from acceptable to out-of-spec without a single process parameter changing.

Effective incoming-material control starts with supplier agreements that specify not just grade but measurable acceptance criteria: moisture range, particle size distribution, fat content, microbial limits. Every delivery should arrive with a certificate of analysis (CoA), and your team should spot-check against it rather than accepting on trust.
Recipe management is the other half. Standardising bio-based inputs and formulations reduces batch-to-batch variation and, in agricultural and food contexts, can increase yield while reducing waste. The principle translates directly to factory recipes: a locked, version-controlled formulation with defined tolerances for each ingredient addition is the single most reliable way to protect yield from human variation.
Incoming-material and recipe control checklist:
A food manufacturer that tightened flour moisture acceptance criteria from ±5% to ±2% and locked recipe water additions to the nearest 0.1 kg reduced rework on one biscuit line by roughly a third within eight weeks, with no capital expenditure. The fix was a revised supplier specification and a digital recipe card replacing a paper one.
An MES removes the data blind spots that make yield problems hard to diagnose. Instead of reconstructing what happened from paper batch records after the fact, you see process parameters, alarms, and quality results in real time, linked to the specific lot or batch that produced them.
Mestric connects directly to manufacturing equipment, capturing machine states, process parameters, and quality measurements automatically. That data feeds SPC dashboards, downtime logs, and cost analytics without manual entry, which removes both the delay and the transcription errors that make paper-based root-cause analysis unreliable.
A typical Mestric pilot scope (weeks 1–8):
Before/after KPI targets for an MES pilot:
AI-driven batch prediction in biologics manufacturing has demonstrated that earlier harvest predictions and faster time-to-insight can deliver measurable yield gains, with one facility reporting a measurable increase in annual yield alongside a shift from days to hours for process insights. The same principle applies across food and discrete manufacturing when an MES provides the underlying data infrastructure.
For a broader view of manufacturing software categories and where an MES fits, Mestric’s overview covers the full stack.
Standard work and error-proofing are the fastest, cheapest yield enhancement practices available. A well-designed fixture that physically prevents a component from being loaded incorrectly costs less than one hour of rework and eliminates a defect class permanently.
Low-cost poka-yoke examples:
Training cadence matters as much as content. A 90-minute induction on standard work, followed by nothing for six months, does not sustain yield. Short, focused micro-learning sessions of 10–15 minutes at shift start, tied to a specific recent defect or near-miss, keep quality awareness current without pulling operators off the line for long periods.
The quality ownership question is often overlooked. First-line quality checks should belong to the operator, not the quality department. When operators own their own process data and see their own FPY trend, they respond to drift faster than any downstream inspection screen can.
Profi tipp: At the start of each shift, have operators run a two-minute verification routine: check the three most common defect sources on their line (a worn fixture, a low consumable, a drift-prone setting) and sign off before the first part runs. This single habit prevents the majority of shift-start scrap on most lines.
Selecting the right pilot line is the decision that most determines whether your project succeeds. Use an impact-versus-feasibility matrix: score candidate lines on yield gap size (impact) and data availability plus team readiness (feasibility). The line with the highest combined score is your pilot.
Stakeholder map:
Cost buckets to expect: operator time for data collection and experiments (typically 2–4 hours per week), any consumables for test runs, and MES or software access. A manufacturing optimisation checklist can help you scope costs before the project starts.
A structured cross-functional approach, including BOM accuracy, 5S, and root-cause-driven fixes, delivered a significant FPY improvement and a notable inventory reduction for a large tractor manufacturer over a 30-week engagement.
Tracking the right metrics is what separates a genuine improvement from a temporary fluctuation. Define each KPI before the pilot starts so your baseline and post-pilot measurements are directly comparable.
| KPI | Definition | How to measure | Suggested pilot target |
|---|---|---|---|
| Yield % | Good units out ÷ total units started | MES production counts or ERP order completion | Up to 30% yield improvement potential |
| First-pass yield (FPY) | Units passing all checks first time ÷ total units started | Inspection station data or MES quality module | Up to 30% yield improvement potential |
| Scrap rate | Scrapped units ÷ total units started | MES scrap log or ERP material transactions | Up to 30% yield improvement potential |
| Defects per million (DPM) | (Defects ÷ units × opportunities) × 1,000,000 | Quality inspection records | Up to 30% reduction |
| OEE | Availability × Performance × Quality | Machine data via MES or manual shift log | Up to 30% yield improvement potential |
| Cpk | (USL − mean) ÷ 3σ or (mean − LSL) ÷ 3σ, whichever is smaller | SPC software or control chart data | ≥1.33 on critical parameters |
| Time-to-root-cause | Hours from defect detection to confirmed root cause | MES incident log timestamps | Reduce substantially |
Production KPI tracking becomes significantly more reliable when data flows automatically from equipment rather than being entered manually. Manual entry introduces both delay and transcription error, both of which distort trend analysis.
These examples illustrate how yield enhancement practices translate into measurable results across different manufacturing environments.
A UK contract electronics manufacturer was running FPY of around 82% on a mixed-technology SMT line. Root-cause analysis pointed to inconsistent solder-paste volume as the primary driver, consistent with industry guidance that attributes a significant proportion of soldering defects to the printing stage. The team added SPI after the printer, set control limits on paste volume, and introduced a weekly stencil-cleaning protocol. Within six weeks, FPY moved to 91%. No new equipment was purchased beyond the SPI unit; the stencil protocol was a zero-cost change.
A UK ambient food manufacturer producing snack products was experiencing rework rates of 8–12% on one line, driven primarily by weight and texture variation. Incoming flour moisture was tested only on delivery, with no lot-level traceability. The team introduced lot-specific CoA review, tightened moisture acceptance from ±5% to ±2%, and locked the recipe water addition in the MES. Rework dropped to below 4% within eight weeks. The global evidence on standardised bio-based inputs supports this approach: tighter feedstock standardisation consistently reduces batch-to-batch variation.
A discrete parts manufacturer in the Midlands was losing roughly 6% of output to scrap generated during shift start-up and after changeovers. Autonomous maintenance checks were inconsistent, and changeover procedures varied by operator. The team introduced a daily autonomous maintenance checklist, standardised the changeover SOP, and added a shift-start verification routine. Scrap from start-up and changeover fell by just over half within 12 weeks, with no capital investment.
Lessons from all three:
Regenerative and precision management approaches in agricultural contexts show the same pattern: spatially variable results until standardisation of inputs and practices is achieved, after which gains become consistent.
The most reliable path to measurable yield improvement combines early inspection, process control, and structured CI projects, supported by digital data capture that makes root causes visible in hours rather than days.
| Pont | Részletek |
|---|---|
| Measure before you change | Establish FPY, scrap rate, and Cpk baseline on your pilot line before any intervention. |
| Inspect earlier, not later | Place SPI or in-process sensors before the most expensive rework point to catch defects at minimum cost. |
| Lock materials and recipes | Tighten incoming-material acceptance criteria and version-control recipes to remove the largest source of batch variation. |
| Run structured CI projects | Use DMAIC or DOE to find robust process setpoints; a 4–12 week pilot with clear KPI gates is enough to confirm ROI. Yield improvement potential can reach up to 30% with combined SPC, root-cause analysis, and AI-enabled prediction. |
| Mestric MES for real-time visibility | Mestric connects equipment data to SPC dashboards and lot genealogy, cutting time-to-root-cause from days to hours. |
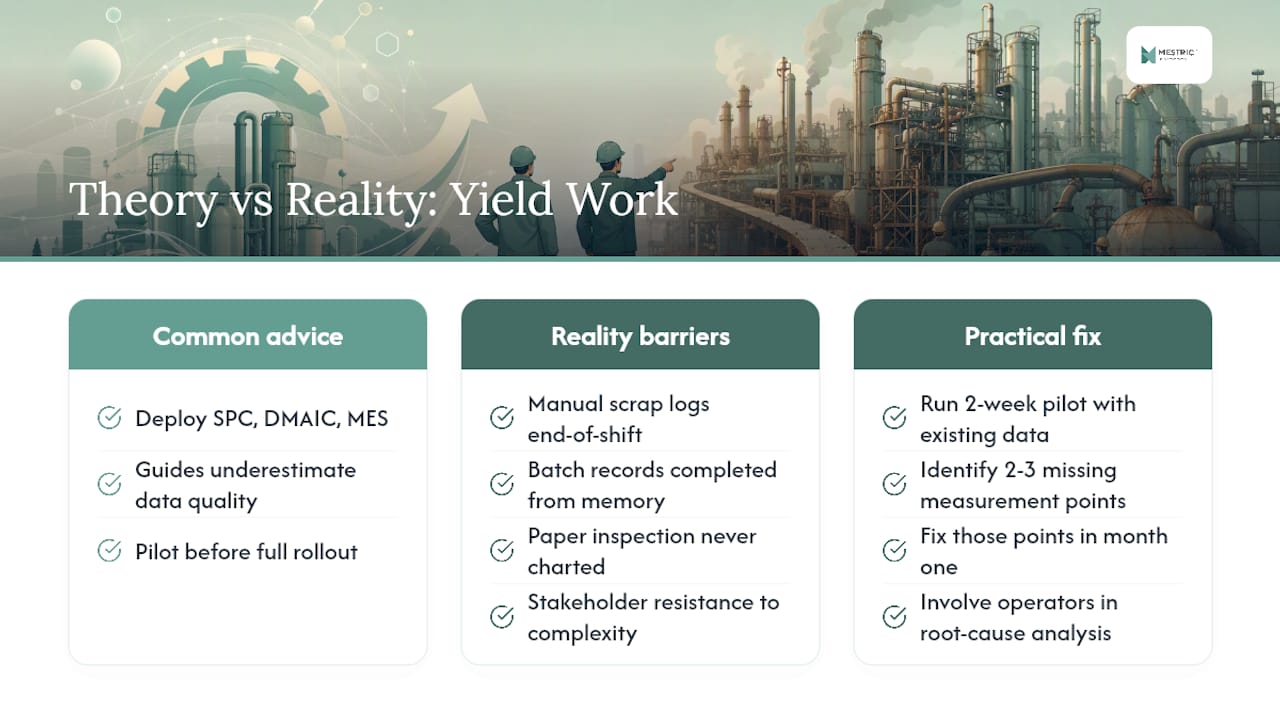
Most yield improvement guides present the methods correctly but underestimate the single biggest obstacle: data quality. You can deploy SPC, run a DMAIC project, and install an MES, and still see no sustained improvement if the underlying data is unreliable. Manual scrap logs filled in at end-of-shift, batch records completed from memory, and inspection results recorded on paper that never reaches a control chart are all common in UK manufacturing. They do not give you a yield problem. They give you a data problem that looks like a yield problem.
The practical fix is not to wait for perfect data before starting. Run your first two weeks of the pilot with whatever data you have, and use that period to identify where the gaps are. You will almost always find that two or three measurement points are missing or unreliable, and fixing those is the highest-value action in the first month.
The second underestimated factor is stakeholder resistance to process changes that increase short-term complexity. Operators who have worked a line for years will push back on new inspection steps or tighter acceptance criteria, not because they are obstructive, but because they have learned to compensate for process variation in ways that are invisible to management. Involving them in root-cause analysis, rather than presenting them with a solution, converts that institutional knowledge into an asset.
A global meta-analysis on cropland management makes a point that applies equally to factory lines: the dominant factors in yield response are often site-specific. The same is true in manufacturing. A technique that delivered 40% FPY improvement in one plant may deliver 10% in another, because the root causes differ. The pilot template in this article is designed to surface your specific root causes before you commit to a full rollout.
Yield improvement projects stall when the data disappears after the pilot. Process engineers move on, paper logs accumulate, and within three months the line drifts back to its previous state. The difference between a one-off project and a sustained capability uplift is whether your process data is captured automatically, visible in real time, and tied to specific lots and shifts.

Mestric connects directly to your equipment, captures process parameters and quality results without manual entry, and presents SPC dashboards, downtime analysis, and FPY trends in a single view. When an alarm fires, the lot genealogy is already there. When you need to justify the ROI of a yield project to your board, the before-and-after data is in the system, not in a spreadsheet on one engineer’s laptop.
For UK manufacturers ready to move from a paper-based baseline to real-time production tracking, Mestric offers an onsite demonstration scoped to your line and your KPIs. Book a demo to see how quickly the first data connections can be live.


 069 763 552