

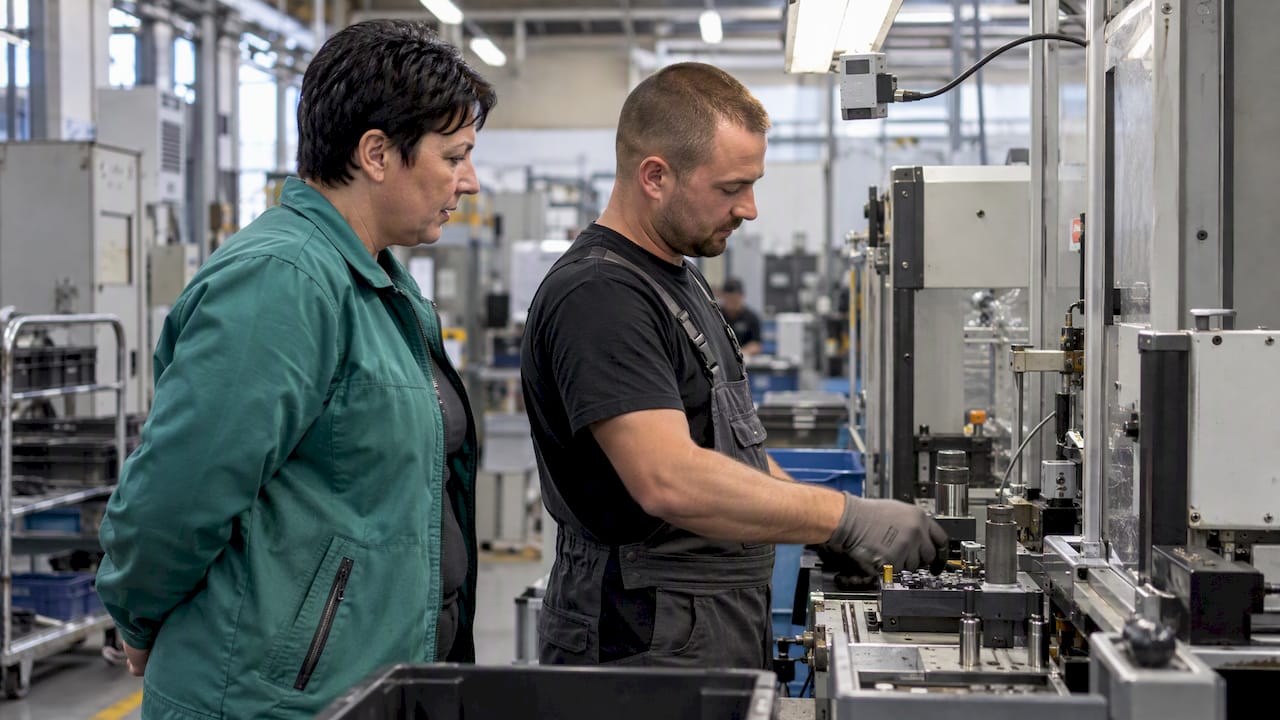
Operator tracking gives you live visibility of who is working where and when. That can help identify bottlenecks and inform efforts to improve throughput. Start with a scoped pilot: pick two or three KPIs, use the least intrusive sensors that meet your accuracy needs, and complete the GDPR transparency and trade union consultation steps before any data is collected.
TL;DR:
- Choose two or three positive KPIs, such as station time, recovery time, and throughput per task, instead of idle time or error counts.
- Run the pilot on one line and one shift, verify sensor data against MES timestamps, then test one operational change before expanding.
- One study found 7% shorter completion times after capacity adjustments and reductions of up to 16% with an extra bottleneck worker; treat these as benchmarks.
- Before monitoring in Slovenia or the EU, consult trade unions or works councils; notice alone is insufficient, and methods must be proportionate and minimally intrusive.
- Choose UWB for workstation assignment, with roughly 30 to 50 centimeter accuracy; BLE offers around 1 meter and suits zone level proximity.
The business case rests on gains such as shorter completion time, faster recovery after failures, better line balancing and clearer quality visibility. To make those gains measurable, track a short list of indicators:
Choose positive, worker-centred metrics such as run time and recovery time rather than idle time or error counts, as practitioner research recommends.
Small capacity adjustments based on worker position data cut completion time by 7%, and assigning an extra worker to bottleneck tasks cut it by up to 16%, according to a 2023 study on worker position data. Those gains came from reallocating existing capacity, not from a large investment.

Move from idea to measurable improvement in three stages, with people involved from day one.
Involve operators, your works council or trade unions, and your data protection officer early. Involving people in choosing the metrics can make dashboards more acceptable. When you present results, good data visualisation makes the same screen useful to both supervisors and operators.
Pro Tip: Change one thing at a time during the pilot, otherwise you cannot tell which change moved the numbers.
Monitoring must be proportionate, transparent and the least intrusive option available. Under Slovenia’s 2023 Data Protection Act and EU GDPR principles, employers must consult trade unions or works councils before introducing video surveillance or advanced behaviour tracking. Informing workers is not enough.
Before you switch anything on:
Eurofound notes that systematic, continuous monitoring increases privacy risk, and recommends using the data for organisational learning rather than punitive individual tracking. Frame the project that way from the first conversation with your team.
Use worker position data to build a data-driven process model. It shows the station times that create bottlenecks and lets you simulate small capacity shifts before you touch the real line. If you want a refresher on spotting the constraint, see how to identify production bottlenecks, and our guide to balancing a production line covers how to test changes without stopping the plant.
In the studied case, small data-driven adjustments reduced completion time by about 7%, while an extra worker at the bottleneck delivered up to a 16% reduction, as the same study on worker position data reports. Treat those figures as a benchmark from one study, not a promise for your line.
Many tracking projects fail through culture, not technology. Choose KPIs with your operators so the numbers do not demotivate them, and build dashboards that help the person on the line as much as the person in the office. Start small and measure one change. Before you begin, confirm five things: the scope, the least intrusive sensors, the data protection check, the pilot duration and the single operational change you will test.
Stitching sensors, machine signals and dashboards together by hand is where pilots stall. We built Mestric™ MES to connect directly to your machines, so supervisors can see live KPIs and dashboards. Our real-time performance tracking provides visibility into production performance, and the data supports the governance steps above.
Request a demo of Mestric™ MES and see the system working in a real production environment.
It is the use of sensors and software to record where operators are and which tasks they perform. Supervisors use it to see station times, utilisation and recovery after stoppages in real time.
Choose two or three, such as station time, recovery time and throughput per task. OEE can then aggregate availability, performance and quality once the basics are reliable.
Yes. In Slovenia and the EU, employers must consult trade unions or works councils before introducing technology that monitors performance or behaviour. Transparency and proportionality also apply.
UWB gives sub-metre accuracy, around 30–50 cm, which suits workstation-level assignment. BLE is coarser, around 1 m, and works when zone-level proximity is enough.
Match the sensing approach to the accuracy you actually need. Most lines do not need the most precise option everywhere.
Single sensors are noisy, so combine them. A software-sensor approach that fuses UWB positioning with fixture sensors can estimate activity times and feed real-time OEE calculations. A 2025 cyber-physical architecture goes further: UWB tracking plus machine-learning classifiers assign operator activities to workstations and separate value-added from non-value-added tasks.
Plan for practical limits too: coverage area, wiring or PoE for anchors, battery replacement and maintenance, and the integration points with your MES that supply timestamps and product IDs. Reliable installation matters, and monitoring systems also depend on sound technical design, as this partner post on monitoring systems in facility safety explains.
Pro Tip: Start with zone-level tracking on one line and add precision only where the data shows you need it.


 069 763 552