

Zmanjšanje reklamacij, or complaint reduction, comes down to combining three disciplines: targeted failure mode and effects analysis (FMEA), a single ISO-aligned complaints intake with clear metrics, and system-level fixes rather than one-off case repairs. Evidence from organisational studies and public case examples shows this combination working, though the effects usually take twelve to twenty-four months to fully surface. The rest of this article shows you how to build it, starting with the FMEA evidence.
TL;DR:
- Complaint reduction efforts typically take twelve to twenty-four months to show significant results, especially when using FMEA and system fixes.
- Implementing a structured complaints intake process with specific metrics and classifications enables effective pattern identification and targeted improvements.
- Focusing on root cause analysis and addressing system-level issues through process redesign, automation, or data governance yields more durable reductions in recurring defects.
- Quick wins are possible through clearer communication and simple preventative measures, like physical checkpoints and improved instructions, without major engineering changes.
- Real-time shop-floor data collection via MES platforms accelerates root cause analysis, improves traceability, and enhances the likelihood of sustained complaint reduction.
Design FMEA (DFMEA) examines a product’s design before it reaches production, flagging failure modes that would otherwise turn into field returns. Process FMEA (PFMEA) does the same job for the manufacturing steps themselves, catching the operator errors, tooling drift, and material handling issues that create defects nobody designed for. The two tools overlap in purpose but not in scope: DFMEA protects you from bad engineering decisions, PFMEA protects you from bad execution of good ones.
An organisational study on FMEA and customer complaints found a significant reduction in complaint volume after DFMEA and PFMEA were introduced, with the effect becoming clearly visible around two years after implementation. That timeline matters. Teams that expect results in a single quarter usually abandon FMEA before it has had the chance to work.
A sensible starting scope looks like this:
Most factories collect complaints. Few structures them well enough to act on. A single intake channel with a fixed set of required fields turns scattered emails and phone calls into a dataset you can actually mine for patterns, which is the whole point of the exercise.
At minimum, capture:
Classify every complaint into a taxonomy of five or six categories, such as dimensional defect, material failure, missing component, labelling error, and packaging damage.
Track four metrics from day one: complaint rate per 1,000 units, recurrence rate for previously “closed” issues, time-in-state at the 75th percentile, and first-contact resolution (FCR). ISO guidance on complaints handling recommends exactly this kind of structured intake, paired with management review and periodic auditing, as part of an integrated quality management process rather than a standalone customer service function.
Strokovni nasvet: Put complaint data on the same monthly review agenda as scrap rate and downtime. If quality leadership only sees complaints when something goes badly wrong, the review process is failing before it starts.
Closing an individual complaint feels productive. It rarely stops the same failure from recurring next month, because most closures fix the symptom in front of you rather than the mechanism producing it. Root-cause analysis (RCA) exists to force that distinction.
Five Whys and Ishikawa (fishbone) diagrams remain the practical starting tools, but they only earn their keep when you validate the hypothesis against real data. Pull the logs, run a small process-mining query, or check the machine parameters at the time of the defect batch. A systematic RCA approach argues that quantifying cost per incident and recurrence risk is what makes prioritisation genuinely business-driven rather than guesswork dressed up as analysis.
Durable fixes tend to fall into four buckets:
Prioritise using frequency multiplied by severity multiplied by fix leverage: a change that removes twenty complaints a month beats one that removes two, even if the second feels more urgent. RCA that stops at “operator error” without assigning an owner to a control change rarely survives the next shift rotation, treating complaints as system-improvement signals rather than isolated incidents is what makes fixes stick. Track recurrence rate afterward, not just the closure count, because closures measure activity while recurrence measures whether the fix actually worked.
Not every reduction needs a redesigned process. Some of the fastest wins come from clearer communication, better instructions, and simple operator controls that catch defects before they leave the line.
One documented case reduced complaints by roughly 40% purely through clearer communication and automated acknowledgement messages, without touching the product itself. An acknowledgement that explains what happens next, in plain language, defuses a large share of frustration-driven follow-up complaints on its own.
On the shop floor, the equivalent move is a poka-yoke device or an enforceable checklist that physically prevents a defective part from advancing. Simple quality control checkpoints at incoming inspection, mid-process, and final test catch a large share of issues before a customer ever sees them.
Strokovni nasvet: Pick one high-volume line, change one communication template and add one physical inspection checkpoint, then measure complaint volume for 30 to 90 days before rolling out further. Small, measured pilots beat plant-wide mandates that nobody can trace back to a cause.

Numbers set expectations. Without a benchmark, “reduce complaints” stays an aspiration rather than a target.
A realistic target for a scoped pilot programme is a noticeable reduction in complaint volume within twelve to twenty-four months. Faster reductions on a systemic fix may warrant scrutiny regarding measurement accuracy.
Manual complaint tracking has a lag problem: by the time a spreadsheet reflects a defect pattern, another week of production has already shipped. A Manufacturing Execution System (MES) closes that gap by capturing quality data at the point it happens, not days later.
The capabilities that matter most for complaint reduction are specific:
MES platforms with real-time monitoring shorten the RCA cycle because the evidence is already logged and time-stamped, rather than reconstructed from memory during a review meeting weeks later.
The uncomfortable truth is that most quality teams already know what causes their top three complaint categories. What’s missing isn’t diagnosis, it’s the discipline to fund a fix, assign an owner, and track recurrence rather than closure count. Leadership commitment and a simple governance cadence matter more than any single tool. Prioritise the fixes with the highest leverage, measure them honestly, and resist the urge to declare victory before the recurrence data confirms it.
— Andraž
A Manufacturing Execution System platform gives production teams the real-time visibility that manual spreadsheets and end-of-shift reports simply can’t match, connecting directly to equipment so defects surface as they happen rather than after a customer notices them first.
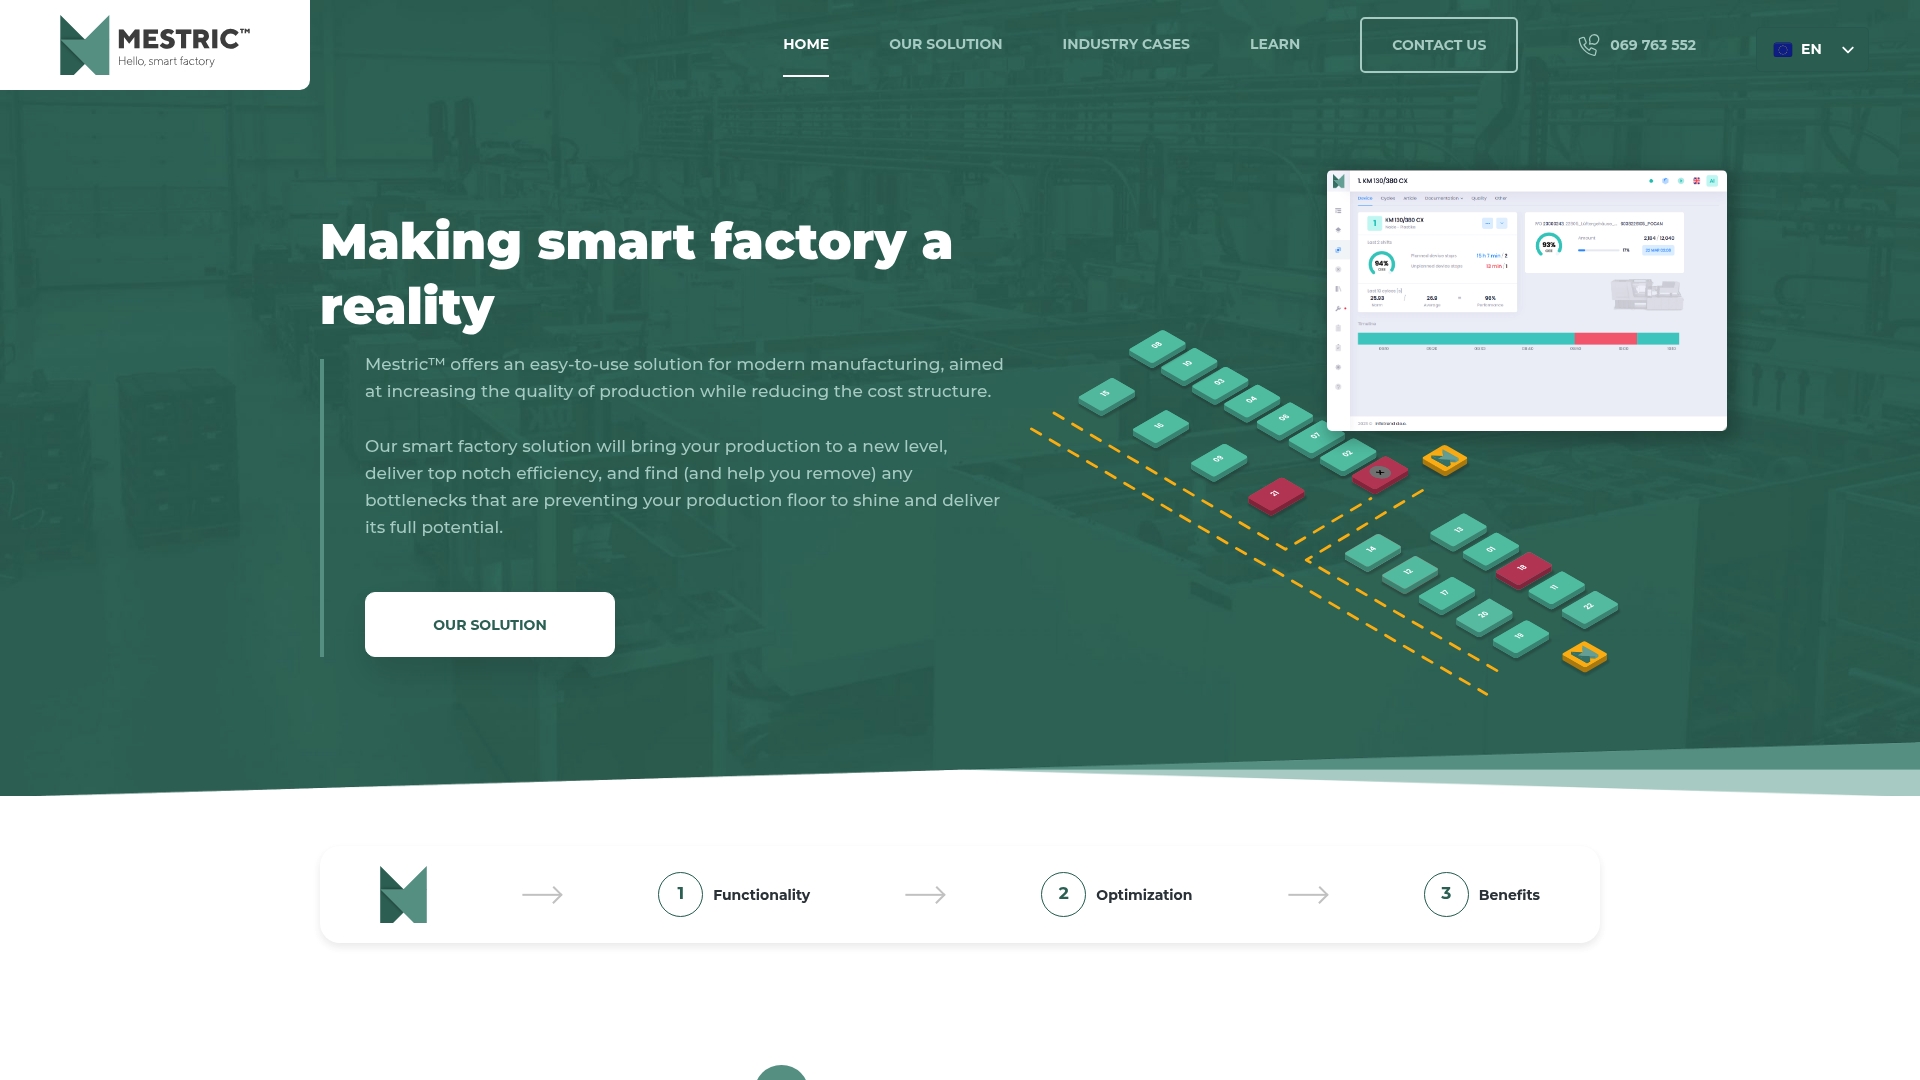
The typical path starts with a demonstration on your own equipment, where you can see exactly which KPIs and quality parameters your line would surface in practice. From there, most teams run a scoped pilot on the highest-complaint product line before rolling the MES platform out further. Automated data capture removes the manual logging errors that slow down RCA, while AI-powered suggestions help quality managers spot the corrective action worth prioritising first. If your current complaint tracking still runs through spreadsheets and email threads, book a demonstration and see what your own production data reveals.
Expect the clearest effects around two years after introduction, based on an organisational study on DFMEA and PFMEA. Early wins are possible on high-frequency defects, but the full pattern takes time to show in the data.
DFMEA examines the product design for failure modes before production begins, while PFMEA examines the manufacturing process itself for points where execution can go wrong. Most complaint-reduction programmes run both in parallel on their highest-volume lines.
Track complaint rate per 1,000 units, recurrence rate on previously closed issues, time-in-state, and first-contact resolution. ISO guidance recommends structuring these within a formal management review cycle rather than tracking them ad hoc.
Yes. Real-time quality monitoring and automated data capture, of the kind Mestric™ provides, shortens root-cause analysis by logging defects and traceability data at the moment they occur, rather than reconstructing it later from memory or spreadsheets.
JYSK’s more than 50% reduction over ten years shows what sustained, multi-year investment can achieve at scale.


 069 763 552