


The fastest way to cut rework is to prevent defects at source: measure your current rework rate, prioritise the top one to three defect types, run rapid root cause analysis, apply mistake-proofing on the line, then validate the fix with a short pilot before scaling it. This guide walks through each step, including the metrics, statistical checks and controls that make the results stick.
TL;DR:
- Tracking first-time-through, rework, and scrap rates over larger samples ensures reliable baseline metrics for measuring improvement.
- Focusing on the top one to three defect types identified through Pareto analysis is critical to tackling the most costly issues first.
- Conducting short root cause analyses with tools like 5 Whys and fishbone diagrams helps pinpoint causes that, once addressed, will prevent recurrence.
- Deploying mistake-proofing solutions such as fixtures, visual aids, and procedural controls creates durable, error-resistant processes on the shop floor.
- Using real-time traceability and an MES like Mestric™ enables quick validation, ongoing monitoring, and sustained reduction of rework and defect rates.
You do not need a long programme to start cutting rework. Most plants can begin this week, using data they already collect on the shop floor.
Each of these steps takes hours, not weeks, and they build on each other: you cannot prioritise defects without a baseline, and you cannot validate a fix without a clear before-and-after comparison.
Strokovni nasvet: Run the pilot on the shift with your most experienced operator first. Their feedback on usability catches problems a spreadsheet never will.
You cannot manage what you do not measure, and rework is no exception. Three figures form the backbone of any baseline:
Sampling matters once you move from full traceability to spot checks. Attribute sampling is appropriate when full inspection is impractical, but the sample needs to be large enough to trust: a normal approximation to the binomial generally holds when N is above 30, and a common rule of thumb requires the smaller of N times the defect rate or N times one minus the defect rate to be at least 5, according to NIST’s guidance on proportion testing.
Statistic: NIST’s process monitoring guidance recommends control charts and capability studies to detect process drift before it turns into scrap, giving teams an early warning rather than a post-mortem.
A one-sided proportion test, as described in the same NIST handbook, lets you check whether a change in defect proportion between two periods is real rather than noise, which matters before you announce a fix has worked.
A fix that addresses a symptom rather than a cause will resurface within weeks. Structured root cause analysis (RCA) is what separates a permanent fix from a temporary patch, and rework.com’s guidance on cutting scrap and rework costs points to the same combination that shop floors have used for decades: measure, then investigate systematically.
Peer review matters more than it sounds. A root cause identified by a single person under pressure to close the ticket often turns out to be the easiest explanation rather than the correct one, and that mismatch is why the same defect reappears a month later.
Strokovni nasvet: Document every RCA session, even the ones that lead nowhere. A dead end recorded today saves someone else from repeating the same investigation next quarter.

Once you know the cause, the next question is how to make the error physically or procedurally difficult to repeat. Mistake-proofing, or poka-yoke, is the most durable answer because it removes the reliance on an operator remembering a step correctly every single time.
A practical RCA example from a UK government publication shows how far procedural fixes can go: redesigned training, reassessment and updated sign-off procedures reduced recurrence for a defect traced to human error, without any new equipment at all.
A fix is not proven until it has survived contact with a real shift under real conditions. A short, well-defined pilot answers that question before you commit resources to a wider rollout.
Recent research into data-driven rework policies backs this cautious, measured approach: causal models that estimate whether the cost of reworking a unit is justified by the expected yield improvement have produced modest but measurable yield gains in industrial studies rather than dramatic overnight results. That is the honest expectation to set with your team: steady, provable improvement, not a single silver bullet.

Working with manufacturing plants in day-to-day operations has reinforced one pattern above all others: the fixes that last are the ones enforced at the point of work, not the ones written down afterwards. Real-time visibility into which station a defect originated at, combined with a station check that will not let a part pass without a sign-off, closes the gap between deciding on a fix and actually running it every shift.
Traceability back to batch, operator and machine is what turns a Pareto chart from a guess into evidence, and it is what makes a pilot’s before-and-after comparison trustworthy rather than anecdotal. Teams evaluating their own environment can review the quality monitoring examples that show these checks in practice, or arrange an onsite demonstration to see the checks running against their own equipment.
— Andraž
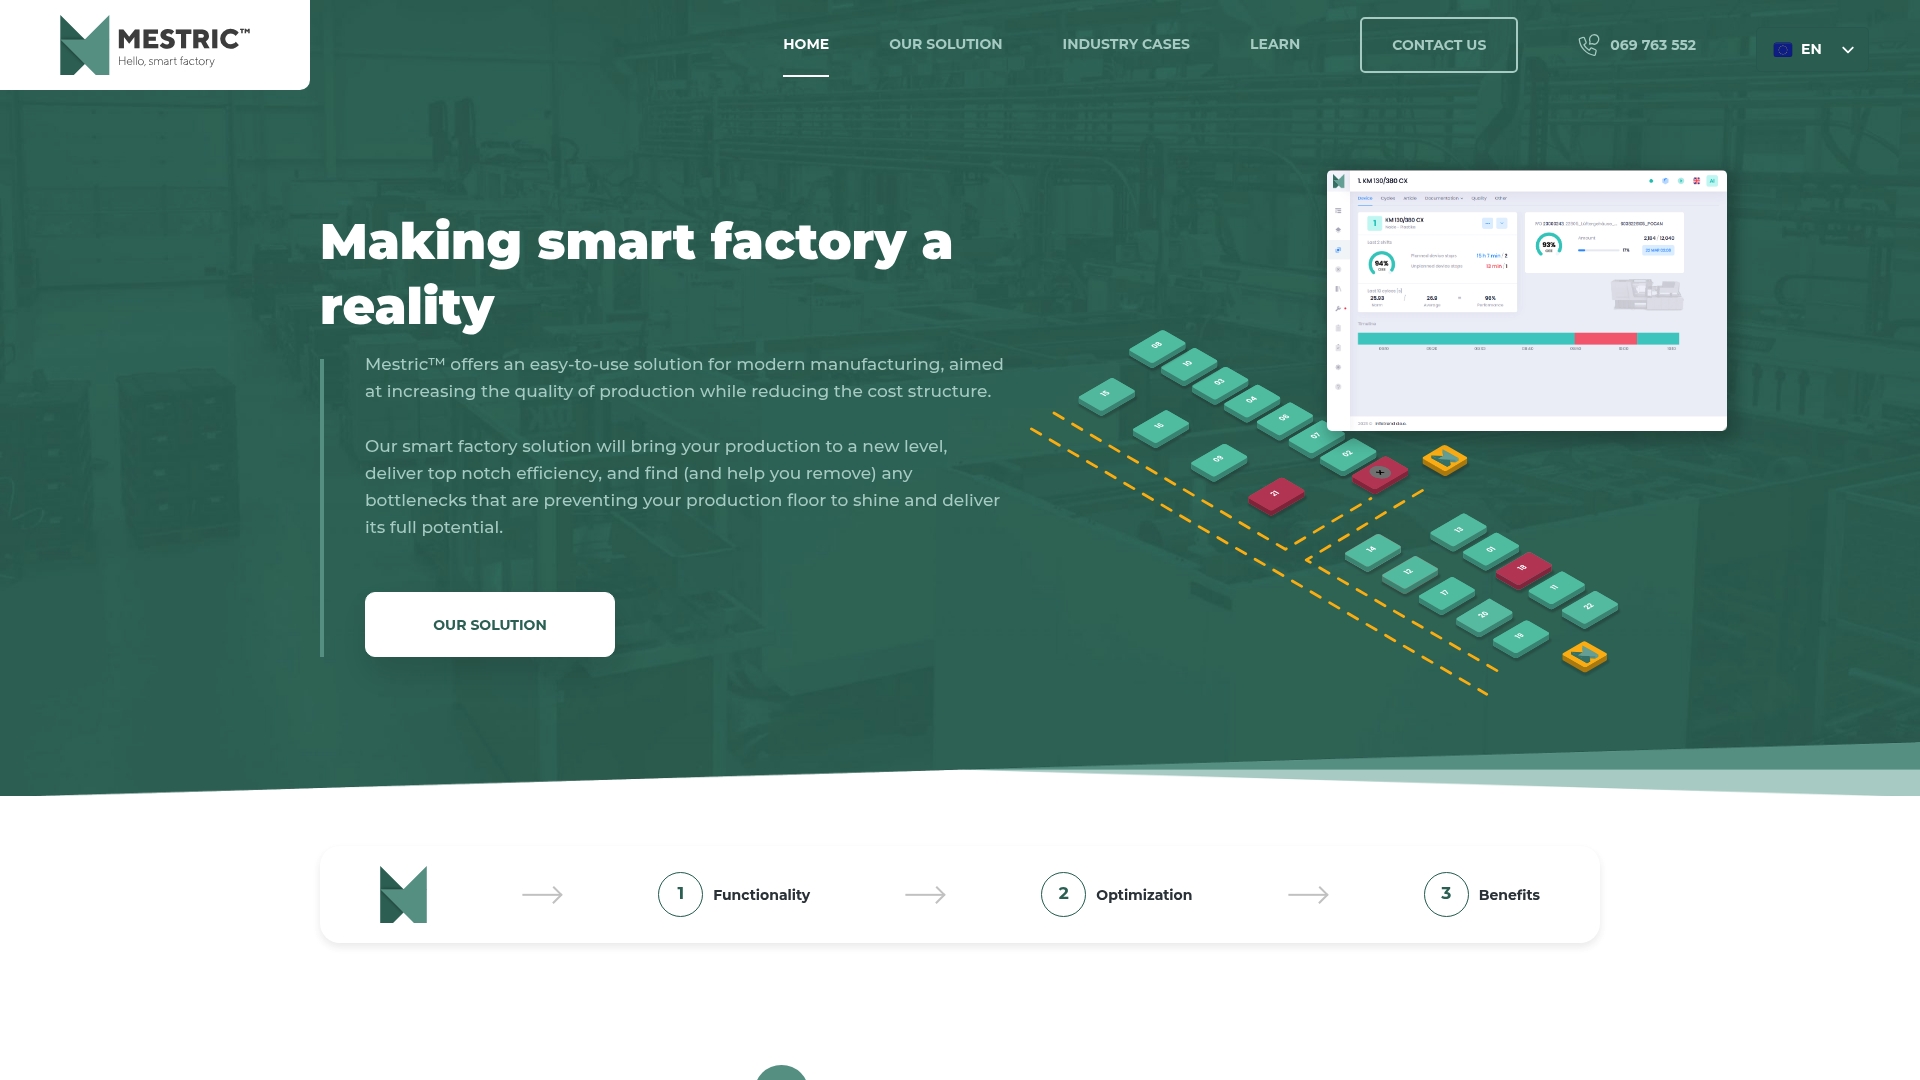
Everything in this guide, from baseline measurement through to sustaining a fix, depends on data that is accurate, timely and tied to the right machine and operator. That is the specific gap Mestric™ MES closes: automated defect capture at the station, enforced assembly steps that will not let a part skip a check, and full traceability back to the batch, operator and machine responsible.
If you are evaluating an MES for this purpose, judge it against a short list of practical criteria:
Mestric™ offers live KPI dashboards and AI-powered process recommendations built to support exactly this kind of pilot. Request an onsite demonstration through Mestric™'s solution page to see how the checks and traceability described above would apply to your own line.
The fastest route is to measure your current first-time-through and rework rates, prioritise the top defect types with a Pareto analysis, and run a rapid root cause session such as 5 Whys before applying a mistake-proofing fix. Validating that fix with a short pilot, rather than rolling it out plant-wide immediately, keeps the change reliable.
First-time-through is the number of good units divided by total units started, expressed as a percentage. Rework rate is the number of reworked units divided by total units produced, and both figures should be calculated over the same period to form a usable baseline.
A normal approximation to the binomial distribution generally holds once your sample size exceeds 30, according to NIST’s guidance on proportion testing. A further check requires the smaller of the sample size times the defect rate, or the sample size times one minus the defect rate, to be at least 5 before the approximation is considered reliable.
Mistake-proofing, or poka-yoke, physically or procedurally prevents an error from happening in the first place, such as a fixture that only allows correct assembly. Additional inspection only catches an error after it has already occurred, so it costs more over time and does not remove the underlying cause.
An MES that captures data at each station, such as Mestric™, can automate the before-and-after comparison a pilot needs by tracking defect rates by batch, operator and machine in real time. This removes much of the manual data collection that otherwise slows down validating whether a fix actually worked.


 069 763 552