


Check station cycle time against takt right now: divide today’s available production time by demand, then compare that number to how long each station actually takes. If every station clears in less time than takt, you have room to rebalance by moving tasks between operators. If one station’s fixed work (a boulder, not a movable task) already runs longer than takt, no amount of reshuffling will fix it. You need process redesign or added capacity instead.
That fifteen-minute check tells you which game you’re playing before you waste a shift on the wrong fix.
Pro tip: A rebalance is realistic in a single shift when movable tasks make up more than 15 to 20% of the bottleneck station’s workload — below that, you’re looking at a redesign project, not an afternoon fix.
TL;DR:
- Rebalancing is only effective if fixed work at a station does not exceed takt time, requiring redesign or parallel capacity for boulders.
- Continuous cycle time measurement using MES enables real-time detection of imbalance, reducing reliance on quarterly audits or estimates.
- Mapping the Yamazumi chart before task reallocation ensures teams target the true bottleneck, preventing misdirection from fixed process work.
- Cross-training operators can turn fixed “boulder” tasks into movable “pebble” tasks, speeding up rebalancing and reducing the need for redesign.
- Pilot testing rebalancing on a limited batch and updating routing and system data immediately is crucial to maintaining a balanced line.
Line balancing (uravnoteženje proizvodne linije) means distributing work content across stations so each one finishes close to takt time, with no station starving the next or piling up queues behind it. Get the vocabulary straight first, because operators, engineers and planners often talk past each other using the same words differently.
| Term | Quick definition | Why it matters |
|---|---|---|
| Takt time | Available time ÷ demand | Sets the target every station must beat |
| Cycle time | Actual time a station takes | Compared directly against takt |
| Yamazumi | Bar chart of station workload | Shows imbalance visually, station by station |
| Boulders | Fixed, unmovable work | Defines the ceiling rebalancing can’t cross |
Pro tip: Draw the Yamazumi before you touch anything. Teams that jump straight to moving tasks usually rebalance around the wrong bottleneck because they never mapped where the real boulder sits.
Run this test before committing resources: identify the slowest station, then check whether its excess time comes from a boulder or a stack of pebbles. Rebalancing only works on the second case. Balancing succeeds only when the fixed work at a station doesn’t exceed takt — once it does, the process itself needs redesigning or running in parallel, because no reassignment of manual tasks touches a machine cycle.
Hidden boulders hide in places engineers overlook:
Mixed-model lines add another layer. When several product variants share a line, WIP buffers between grouped stations absorb short-term imbalance, and parallel station groups can each be balanced independently to their own CTmax objective rather than forcing one line-wide number. A documented automotive case used exactly this grouping approach, treating clusters of stations as parallel sub-lines rather than one continuous chain.
You don’t need a six-month project to rebalance most lines. Follow this sequence and you can pilot a change before the shift ends.
Pro tip: Photograph or export the Yamazumi before and after every pilot, and keep both versions on file. When a rebalance needs rolling back six weeks later, you want the exact “before” state on record, not a memory of what it looked like.
| Step | What “done” looks like |
|---|---|
| Measure | Cycle time and takt calculated from current, real data |
| Map | Yamazumi drawn with boulders and pebbles marked |
| Plan moves | Reassignments respect precedence and skill requirements |
| Pilot | Throughput, queue length and defects tracked together |
| Roll out | Routing and MES/ERP records updated to match the new standard |
Formal models exist for a reason, but most plants only need them at the edges. The elimination method groups operations by precedence and iteratively assigns the minimal-loss set to each station, a technique that’s been taught in production systems courses for decades because it’s transparent enough to do by hand on a whiteboard.
Real-time data doesn’t just speed up measurement, it changes the rhythm of the whole practice. Balancing stops being an event you schedule and becomes something you check continuously, the same way you’d watch a fuel gauge rather than calculate range once a month.
A successful rebalance decays without monitoring. Build these checks into daily routine, not an annual audit.
Stopwatch audits tell you what happened last Tuesday. An MES tells you what’s happening on station four right now, and that difference determines whether you catch drift in an hour or a month.
That shift, from quarterly kaizen event to daily practice, is the single biggest change real-time data brings to balancing work.
Skill spread across your workforce decides how much of your Yamazumi you can actually rebalance. A pebble that takes a trained operator forty seconds might take a new hire ninety, and if your rebalance plan assumes uniform skill, it will fail the moment you rotate staff.

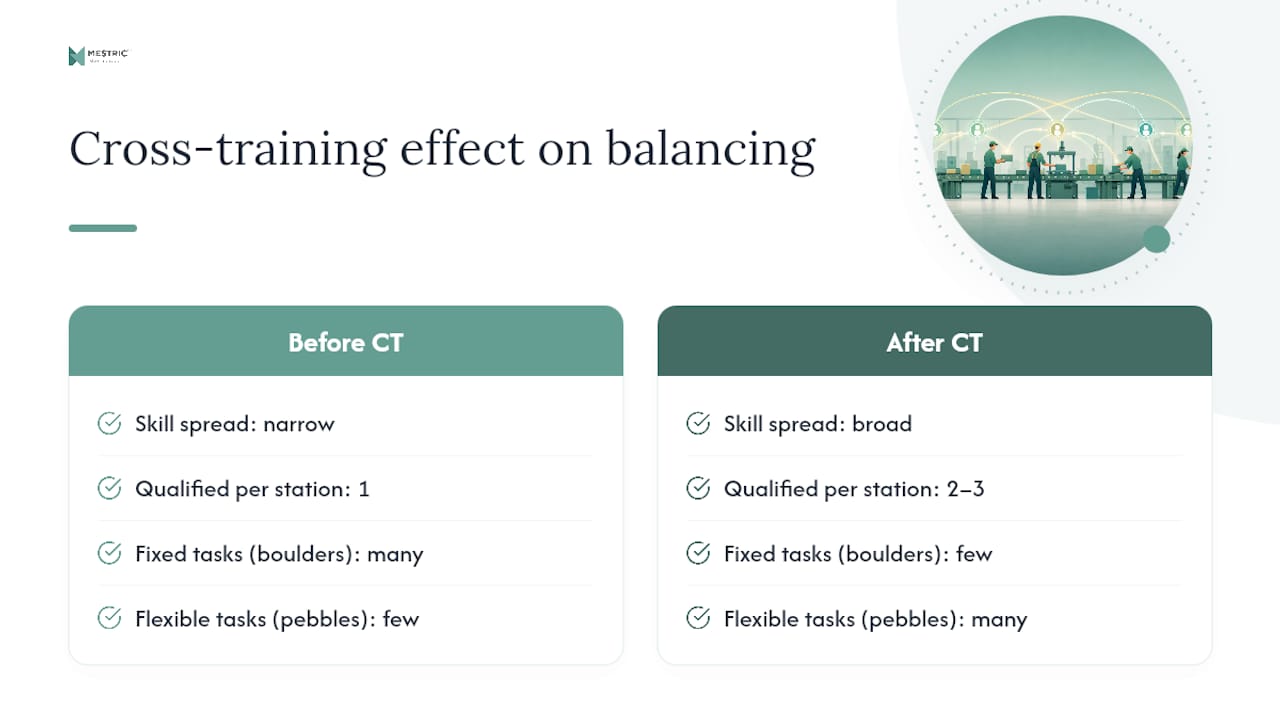
Cross-training changes what counts as a movable task in the first place. A station that looks like a boulder because only one person on the floor can run it stops being fixed once two or three operators are qualified on it. That’s not a process redesign, it’s a training investment that turns a hard constraint into a flexible one, often more cheaply than adding equipment.
The reverse also holds. Rebalance a line assuming interchangeable operators, and put an undertrained person on the new bottleneck station, and you’ve traded one imbalance for another that your Yamazumi chart won’t show until defects start climbing.
Build skill matrices into your balancing decisions the same way you’d map machine capability. Before moving a pebble to a new station, check who’s actually qualified to absorb it, and whether that qualification needs topping up first. Lines with broad cross-training recover from rebalancing faster because more of the workforce counts as flexible capacity rather than fixed capacity, which is really the same boulders-versus-pebbles logic applied to people instead of machines.
Most guidance on this topic treats balancing as a project: schedule a kaizen event, bring in a facilitator, spend a week with stopwatches, present a new Yamazumi, move on. That model isn’t wrong, it’s just incomplete, and the gap shows up six weeks later when the line has quietly drifted back out of balance and nobody noticed until output slipped.
The bigger error is skipping the triage step. Teams reach for reallocation before checking whether the bottleneck is even a pebble problem. Move tasks around a boulder for a week and you’ll produce a tidier-looking Yamazumi chart with exactly the same throughput ceiling you started with.
What I’d prioritise first: stop treating measurement as a one-off event. The plants that stay balanced are the ones checking cycle time against takt daily, not quarterly, which is only realistic with continuous data rather than a stopwatch and a clipboard. Get that cadence right before worrying about which algorithm sequences your task moves.
— Andraž
Everything in this article depends on knowing your real cycle times, not estimated ones, and that’s exactly where Mestric fits. Rather than scheduling stopwatch audits and hoping the Yamazumi still reflects reality by the time you act on it, Mestric captures cycle time, downtime and quality events directly from connected machinery, so your balance data updates as the shift runs, not after it ends.

That’s the practical difference for a plant manager coming from this article: you can pilot a rebalance and see the throughput, queue length and defect impact on the same day, instead of waiting for next month’s report to confirm whether the change worked. If you’re ready to see how real-time performance tracking applies to your own line, book a demonstration and bring your current Yamazumi chart. It’s the fastest way to find out where your actual boulders are.
A production line stays balanced only when teams measure cycle time against takt continuously and separate fixed boulders from movable pebbles before reassigning any work.
| Point | Details |
|---|---|
| Check takt first | Compare every station’s cycle time to takt (available time ÷ demand) before changing anything. |
| Separate boulders from pebbles | Fixed process work above takt needs redesign or added capacity, not task reallocation. |
| Pilot before rolling out | Test a rebalance on a limited batch and check throughput, queue length and defects together. |
| Update your systems | Refresh routing, standard work and MES/ERP entries the same day a rebalance is confirmed. |
| Use continuous MES data | Mestric captures live cycle-time and downtime data so rebalancing becomes a daily check, not a quarterly project. |


 069 763 552