


TL;DR:
- Energy monitoring in manufacturing tracks energy use at the asset, line, and plant levels, transforming data into actionable production KPIs. It helps identify inefficiencies, reduce costs, and support sustainability by linking consumption to production, following structured processes like the five-stage data pipeline. Proper implementation includes detailed audits, real-time submetering, automated alerts, and continuous refinement to drive measurable operational improvements.
Energy monitoring in manufacturing is the ongoing, detailed measurement and analysis of energy consumption linked directly to production lines, shifts, or individual SKUs. It goes far beyond reading a monthly utility bill. The role of energy monitoring in manufacturing is to transform raw consumption data into a production KPI that plant managers and energy officers can act on immediately. Proper energy audits can unlock 10–25% savings on overall consumption. That figure represents real margin, not theoretical potential. Standards such as ISO 50001 provide the framework for turning that potential into verified, repeatable results.
Energy monitoring improves operational efficiency by making waste visible at the point where it occurs. A plant-level utility bill tells you how much energy you consumed. Submetered data tells you which line, which shift, and which asset consumed it, and whether that consumption was justified by output.
The operational gains are direct and measurable:
Submetering to machine and line level reveals energy variance of 15–30% between identical production lines. That variance is hidden efficiency loss. Once visible, it becomes a target.
Strokovni nasvet: Track energy intensity per shift, not just per day. Night shifts often run the same equipment at lower utilisation, inflating energy per unit produced. Shift-level data makes that visible within 48 hours of deployment.

The connection between energy data and production data is what separates monitoring from measurement. Monitoring without production context produces numbers. Monitoring with production context produces decisions.
Energy intensity and energy efficiency are not the same metric. Energy intensity measures consumption relative to output, for example kilowatt-hours per tonne produced. Energy intensity alone is a flawed proxy for true efficiency because it shifts with product mix and line utilisation. A plant running high-complexity SKUs will show worse energy intensity than one running simple products, even if the former is technically more efficient. Micro-level audit data is necessary to validate genuine efficiency gains.
Effective energy monitoring operates across three levels:
| Level | What it measures | Primary use |
|---|---|---|
| Plant level | Total site consumption | Utility bill validation, carbon reporting |
| Line level | Consumption per production line | Shift comparison, line benchmarking |
| Asset level | Consumption per machine or process | Fault detection, maintenance scheduling |
Each level adds granularity. Asset-level data is where the most actionable insights live, but it requires IoT sensors and real-time data collection infrastructure to deliver reliably.
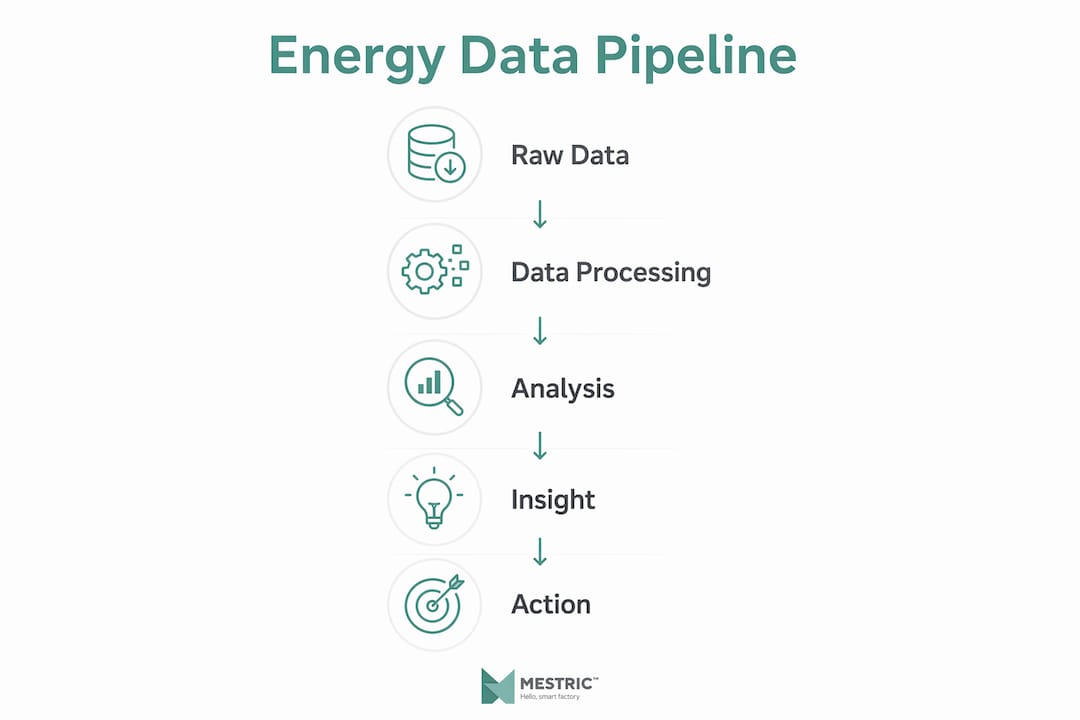
Raw meter readings become useful only when processed through a structured pipeline. A five-stage pipeline converts readings into operator alerts, maintenance work orders, and management reports. The stages are: data collection, validation, analysis, alerting, and reporting. Skipping any stage produces data overload rather than insight.
Demand charges can compose 30–50% of energy bills. Load-level metering identifies which assets drive peak demand, enabling load-shedding logic that reduces demand charges by 12–20% without affecting production output. That is a financial return available to any plant with submetered data and a basic control strategy.
Strokovni nasvet: Deploy Energy Value Stream Mapping (EVSM) alongside your existing value stream maps. It overlays energy consumption onto process steps, making it immediately clear which steps consume energy disproportionate to the value they add.
Structured energy monitoring is the operational backbone of any credible sustainability strategy. Without granular consumption data, carbon reduction targets are aspirational rather than measurable. With it, they become engineering problems with defined solutions.
Energy monitoring aligns directly with ISO 50001, the international standard for energy management systems. ISO 50001 requires organisations to establish energy baselines, set performance indicators, and demonstrate continual improvement. Monitoring data provides all three inputs. The standard does not prescribe technology, but it does require evidence, and submetered data is the most credible form of evidence available.
The practical sustainability benefits include:
Top-tier manufacturing plants have improved energy intensity by up to 20% through structured efficiency programmes and audits. That improvement is not achieved through broad initiatives. It comes from identifying specific assets, processes, and behaviours that consume energy without proportionate output. Monitoring provides the evidence. ISO 50001 provides the governance structure. Together, they create a repeatable improvement cycle rather than a one-off project.
Linking consumption data to structured environmental monitoring frameworks is increasingly common in plants pursuing integrated operational and environmental compliance. Energy and environmental data share the same IoT infrastructure, making combined reporting more efficient.
Effective implementation follows a defined sequence. Skipping steps produces incomplete data and weak buy-in from the teams who need to act on it.
Conduct a thorough energy audit. Map every significant energy-consuming asset in the plant. Identify which processes account for the largest share of consumption and where the greatest variance exists between shifts or lines. Audits consistently unlock 10–25% savings potential that would otherwise remain invisible.
Establish energy as a production KPI. Track energy by line, shift, or SKU rather than relying on plant-level utility bills. This single change drives behavioural accountability across operations teams. When a shift supervisor sees energy per unit on the same dashboard as output rate, energy becomes a performance metric rather than an overhead cost.
Deploy IoT-enabled smart metering at asset level. Install submeters on high-consumption assets and integrate readings with your production data system. IoT monitoring and predictive maintenance can reduce energy costs by up to 40% and maintenance costs by 18–25%. The sensor investment pays back through both energy savings and reduced unplanned downtime.
Build automated feedback loops. Configure the system to generate operator alerts when consumption exceeds defined thresholds and to raise maintenance work orders when anomalies suggest equipment degradation. Raw data sitting in a dashboard does not save energy. Automated alerts that reach the right person within minutes do.
Review and refine continuously. Effective energy monitoring frameworks require continuous refinement aligned with production changes. When you introduce a new product line or change shift patterns, your energy KPIs must be updated to reflect the new baseline. A static monitoring system becomes irrelevant within months of a significant production change.
Integrating energy KPIs with your broader production performance tracking framework is the step that converts monitoring from a compliance exercise into a genuine operational tool. When energy, quality, and throughput data share the same platform, the interactions between them become visible and manageable.
Energy monitoring in manufacturing delivers its greatest value when consumption data is linked directly to production lines, shifts, and assets rather than tracked at plant level alone.
| Točka | Podrobnosti |
|---|---|
| Submetering reveals hidden losses | Energy variance of 15–30% between identical lines becomes visible only with asset-level data. |
| EVSM cuts waste simultaneously | Energy Value Stream Mapping reduced electricity use by 13.7% and lead time by 33.7% in documented trials. |
| ISO 50001 requires evidence | Structured monitoring provides the baselines and performance indicators the standard demands. |
| Five-stage pipeline prevents overload | Converting readings into alerts and work orders stops data accumulation and drives action. |
| IoT monitoring reduces costs significantly | Smart sensor deployment can reduce energy costs by up to 40% and maintenance costs by 18–25%. |
Most plants that struggle with energy monitoring share the same problem. They install meters, build a dashboard, and then wait for savings to appear. They do not appear.
The issue is not the technology. IoT sensors and real-time data platforms are mature and reliable. The issue is that monitoring without a defined response protocol is just observation. I have seen plants with hundreds of submeters and no process for acting on what those meters report. The data sits in a system, the dashboard looks impressive in board presentations, and consumption stays flat.
The second failure I see consistently is treating energy monitoring as a finance function rather than an operations function. When energy data lives in the finance team’s spreadsheets and reaches the plant floor quarterly, it cannot drive daily behaviour. The moment you put energy per unit on the same screen as output rate and quality yield, operators start treating it as their problem to solve. That shift in ownership is worth more than any sensor upgrade.
The third pitfall is the one-off audit mentality. A single audit identifies savings potential. Acting on that potential requires a monitoring system that tracks whether the savings have actually been realised and flags when they start to erode. Many facility-level audits lack contextual linkage to specific production data, which is precisely why their recommendations fade within a year. Linking consumption to SKUs and shifts keeps the findings alive.
My honest recommendation: start with three submeters on your highest-consuming assets, link the readings to your production output data, and set one alert threshold. That is enough to generate your first actionable insight within a week. Build from there.
— Andraž
Plant managers who want energy data to drive real decisions need it alongside production data, not in a separate system. Mestric connects directly with manufacturing equipment to deliver real-time performance tracking across energy, quality, and throughput KPIs on a single platform.

When energy consumption sits next to output rate, downtime, and quality yield in one view, the interactions between them become clear. A machine drawing excess current while producing below-rate output is a maintenance issue. Mestric surfaces that connection automatically, turning monitoring data into a maintenance trigger rather than a historical record. Explore how manufacturing efficiency in 2026 looks when energy and production data work together from day one.
Energy monitoring in manufacturing is the ongoing measurement of energy consumption linked to specific production lines, shifts, or assets. It transforms energy from an overhead cost into a manageable production KPI that drives efficiency and cost reduction.
Energy monitoring provides the consumption baselines and performance data required by ISO 50001 and frameworks such as the UK’s SECR. It enables before-and-after verification of energy-saving measures and supports accurate Scope 2 carbon reporting.
EVSM overlays energy consumption data onto a standard value stream map, identifying which process steps consume energy disproportionate to their output value. One documented application reduced electricity consumption by 13.7% and cut lead time by 33.7%.
Asset-level submetering delivers the most actionable data. Submetering to machine and line level reveals energy variance of 15–30% between identical lines, which plant-level or line-level metering alone cannot detect.
The most common failure is collecting data without a defined response protocol. Without a five-stage pipeline that converts readings into operator alerts and maintenance work orders, monitoring produces data overload rather than energy savings.


 069 763 552