

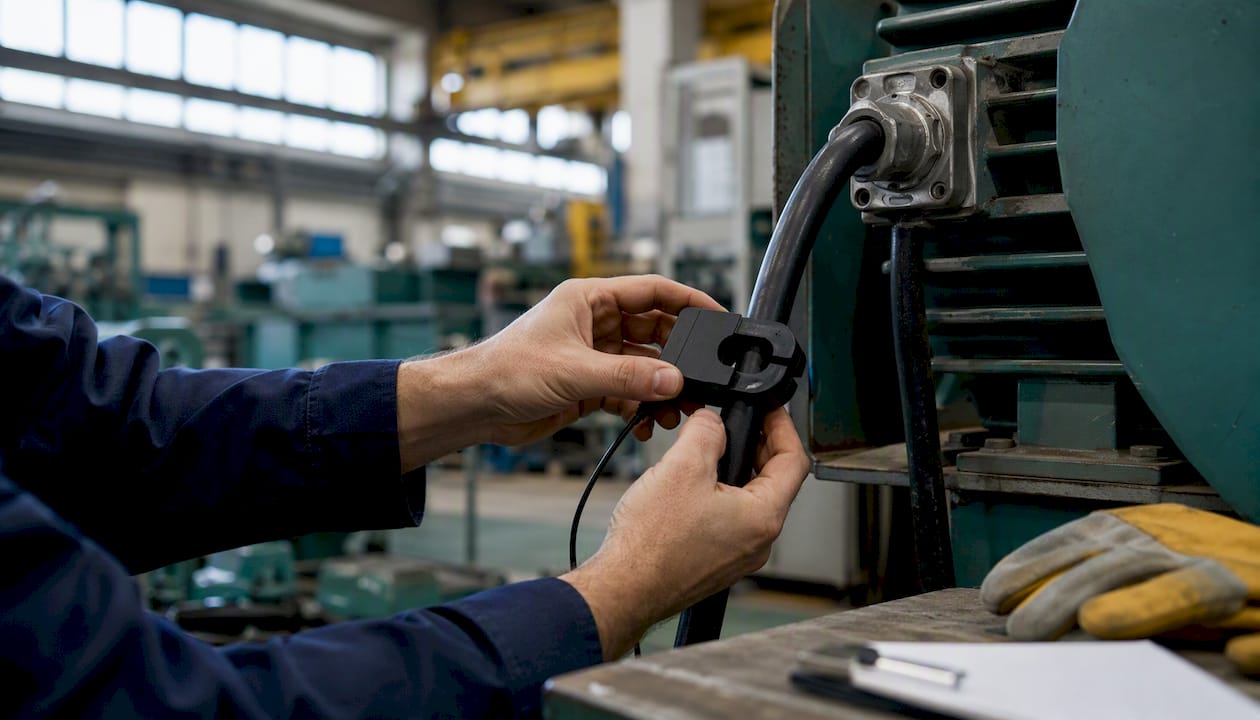
Machine- and line-level energy consumption tracking means measuring kW and kWh at individual machines, production cells, and process lines inside your MES, then computing KPIs such as kWh per part, cost per unit, idle draw, and CO2e per product. This is not building-level metering. It is production-context data: energy tied to work orders, product families, and shift patterns so you can act on it.
Platforms like Mestric connect these readings directly to the MES equipment model, placing energy alongside OEE without manual exports. The Trelleborg Bridgwater pilot is one of the clearest published examples: CT clamps on individual machines, heatmaps by product family, and a reported return on investment of around four months.
The canonical elements of any deployable example:
Machine-level energy tracking integrated into an MES produces kWh per unit, cost per part, and idle-waste alerts that building meters cannot deliver, with payback typically measured in months rather than years.
| Točka | Podrobnosti |
|---|---|
| Start with CT clamps on high-draw machines | One CT clamp per machine feeder gives kWh per shift and kWh per unit with minimal installation. |
| Treat meters as MES equipment nodes | Attaching energy tags to the UNS equipment model makes kWh per unit a native MES metric, not a spreadsheet calculation. |
| Idle draw is the fastest saving | Standby and weekend consumption often accounts for a disproportionate share of total site energy; alerts can fire within minutes. |
| Four-month payback is achievable | The Trelleborg pilot reported approximately four months’ ROI; the worked example above shows around five months for a single cell. |
| Mestric delivers this out of the box | Mestric connects machine energy tags to the MES equipment model so teams see kWh per unit alongside OEE in one platform. |
Six deployable examples, each with a sensor recommendation and the MES view your team should expect.
Example 1: Per-machine instantaneous power on a CNC or lathe
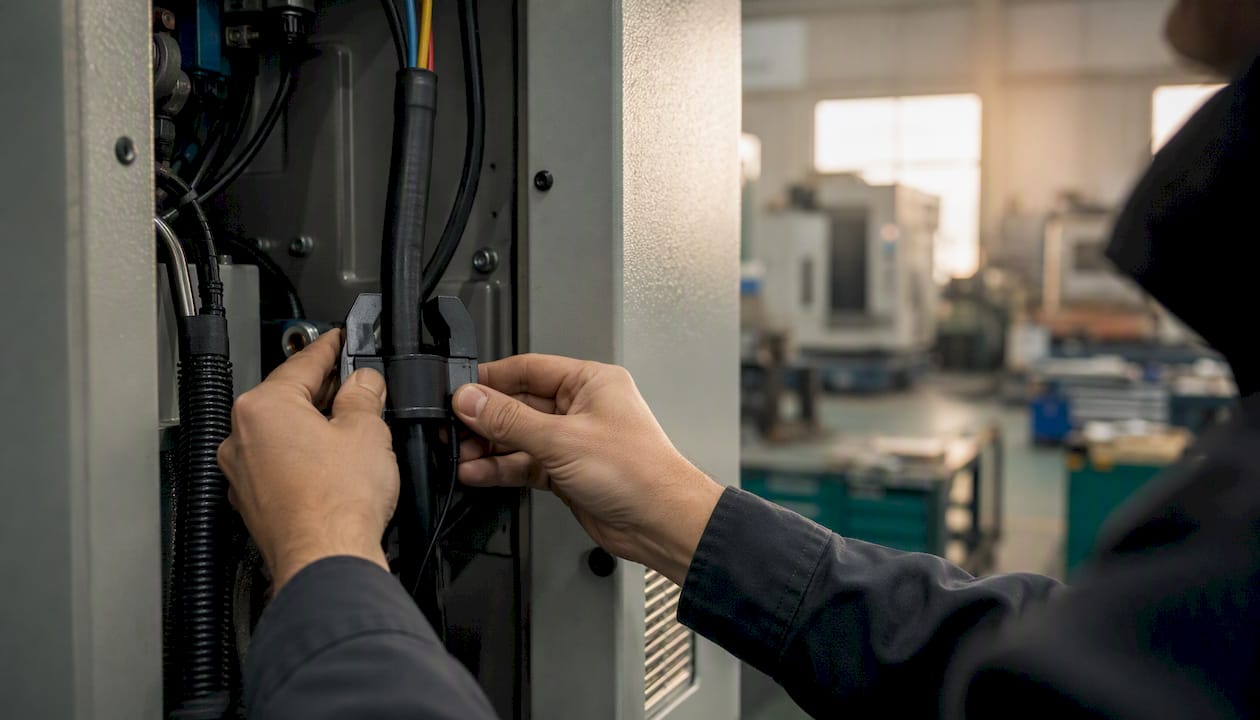
A CT clamp wraps around the incoming supply cable. The edge gateway logs kW at 1-second intervals and rolls up to kWh per shift. The MES widget shows live kW, cumulative kWh, and kWh per part computed against the work order counter. This is the starting point for most pilots.
Example 2: Line-level submetering for a packaging or assembly cell
A panel submeter sits at the sub-distribution board feeding the whole cell. kWh per unit is computed by dividing interval energy by the production count from the MES. You see the cell’s energy cost per unit in real time, which surfaces inefficient changeovers and warm-up losses immediately.
Example 3: Thermal process monitoring on ovens and kilns
Interval energy (kWh per cycle) is logged alongside temperature set-point and actual temperature. The Trelleborg case found one oven accounting for roughly 40% of daily electricity on a single value stream. Correlating energy with temperature deviation identifies heating element degradation before it becomes a quality issue.
Example 4: Compressed-air and vacuum system metering
A flow meter on the main compressed-air header, combined with a power meter on the compressor motor, gives you both consumption and delivery efficiency. Idle draw during non-production periods is the most common finding; even a small leak in a ring-main system wastes a measurable share of compressor energy every shift.
Example 5: Standby and idle detection with alerts
The MES compares machine state (from PLC or OPC UA) against live kW. When a machine draws above a configurable idle threshold for more than a set time window (typically 5–15 minutes) while no work order is active, an alert fires. Streaming SQL architectures can generate these idle-waste alerts within minutes of the condition occurring.
Example 6: Product-family heatmaps and kWh-per-product comparisons
The MES aggregates kWh per work order by product family over a rolling period. A heatmap view ranks product families by energy intensity. This is the view that drives capital investment decisions: which product family has the worst kWh per unit, and which machine is responsible?
Strokovni nasvet: Start with Example 1 on your highest-draw machine before instrumenting anything else. One CT clamp and a weekend’s data will almost always reveal standby waste that pays for the sensor within a month.
The minimum viable setup for MES integration is a submeter at work-centre level or a CT clamp on the machine feeder, timestamped kW/kWh readings, and a machine ID that matches your MES equipment model. Everything else builds on that.
Hardware checklist:
Connectivity path: CT clamp or submeter → edge gateway (OPC UA, Modbus TCP, or MQTT) → UNS/historian → MES. Time synchronisation via NTP is non-negotiable; a 30-second clock drift between the energy logger and the MES production counter will corrupt kWh-per-unit calculations.
Data resolution guidance:
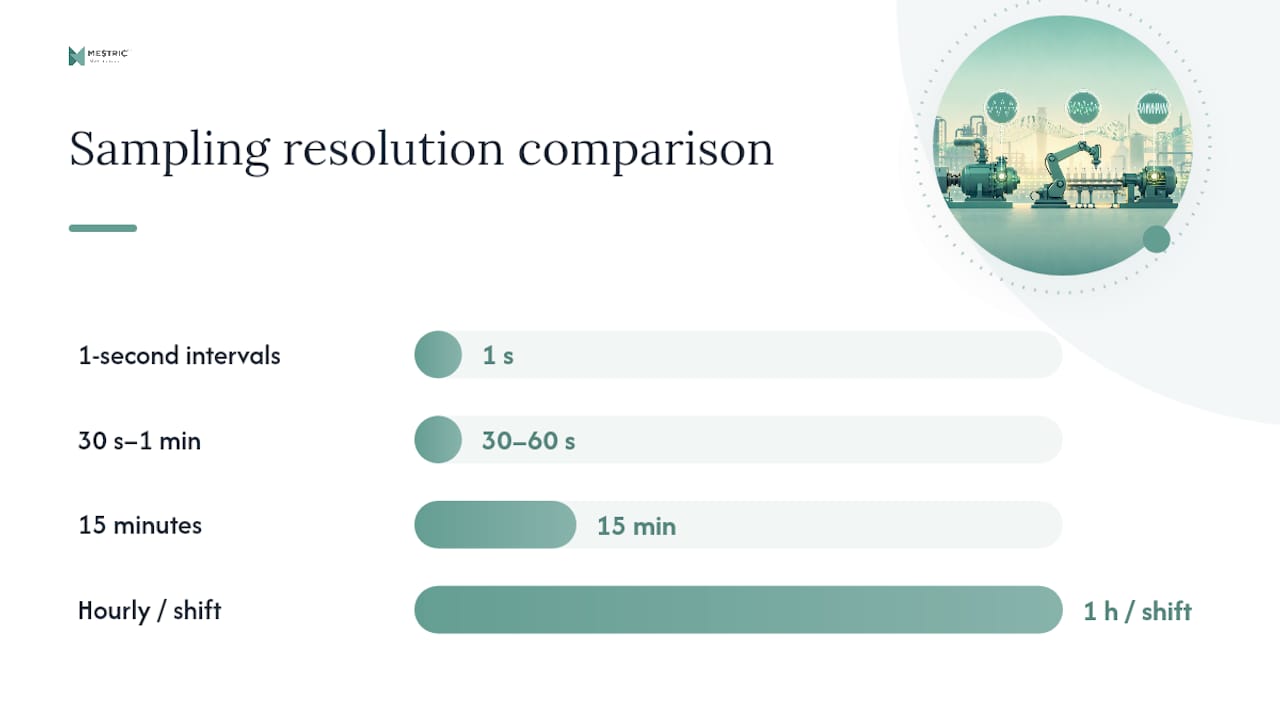
| Resolution | Use case | MES application |
|---|---|---|
| 1-second intervals | Transient load profiling | Idle detection, peak identification |
| 30 s – 1 min | OEE-aligned kWh per part | Work order energy KPIs |
| 15 min | Billing reconciliation | Tariff window cost allocation |
| Hourly / shift | Trend reporting | Heatmaps, product-family comparisons |
MES Engineer advises treating meters as equipment nodes in the UNS so kWh-per-good-part is computed in the same production context as availability and quality, and addressing sampling-rate mismatches deliberately rather than averaging them away.
Strokovni nasvet: Before ordering hardware, audit your existing panel meters. Many factories already have Modbus-capable meters that are simply not connected to anything. Connecting them costs far less than buying new devices.
Energy belongs in the UNS equipment model alongside availability, performance, and quality. When it lives there, kWh per unit and energy cost per part become native computed metrics, not spreadsheet exports.
Data flow: edge gateway → historian/UNS → MES → dashboards. Connectors typically use OPC UA or MQTT for high-frequency reads and a separate 15-minute interval feed for billing. Carry both in the UNS: the fast feed for OEE joins, the interval feed for cost allocation.
KPIs to build in the MES:
A streaming SQL approach joins energy meter streams and production completion events to produce materialised views for energy intensity and idle-waste alerts, with CO2e estimates available for Scope 2 reporting.
MES views to build: energy per work order widget, idle-waste alert feed, heatmap by product family, and a shift summary showing kWh per unit against the rolling baseline. The role of energy monitoring in manufacturing covers how these views connect to broader equipment-level decisions.
The pilot installed CT clamps on individual machines across a value stream that included CNCs, ovens, compressors, and mixers. The project reported a system return on investment of approximately four months.
Key findings from the Trelleborg case study:
The case maps directly to Examples 1, 3, and 6 above: CT clamps (Example 1), thermal process monitoring (Example 3), and product-family heatmaps (Example 6). The four-month payback came primarily from acting on the oven finding and eliminating weekend standby waste.
Magna Liberec achieved an 89.82% reduction in idle machine consumption year-on-year after installing detailed electricity and compressed-air metering integrated with a UNS and MES visualisation, demonstrating the scale of savings available when idle detection is applied systematically.
A focused 8–12 week pilot on a single value stream is enough to prove kWh per unit, detect idle waste, and produce a business case for wider rollout.
Roles required: operations (value stream scoping), maintenance (wiring and sensor placement), IT/MES (gateway configuration and UNS integration).
Minimum acceptance criteria:
The ARC Advisory Group notes that MES/MOM energy management can deliver up to around 30% cost savings in some manufacturing contexts when process efficiency improvements are included.
Payback within months is achievable when idle waste and a single high-draw device are identified early. The Trelleborg pilot reported approximately four months.
Typical cost elements:
Typical saving sources:
Worked example:
Combining energy savings with process optimisation steps typically shortens payback further by reducing changeover time and improving OEE simultaneously. For manufacturers considering automation investments, robotics in sheet metal fabrication illustrates how automation and energy tracking together reduce energy per part on high-volume lines.
Prioritise by combined impact and feasibility: energy intensity multiplied by idle share, weighted by how straightforward the fix is.
Decision framework:
| Criterion | Score 1 | Score 2 | Score 3 |
|---|---|---|---|
| Energy intensity (kWh/unit vs. cell average) | Below average | At average | Above average |
| Idle kW share (%) | under half | around 10% to 25% | more than a quarter |
| Complexity to fix | Requires capital | Requires maintenance | Schedule change only |
| ROI horizon | more than a year | 6–18 months | Under 6 months |
Score each machine across all four criteria and address the highest combined scores first.
Common priority actions:
Product-family heatmaps make capital prioritisation straightforward: the asset with the worst kWh per unit on your highest-volume product family is the clearest replacement candidate. Pairing this with energy efficiency guidance for factories helps you build the investment case with supporting data.
The single most underestimated issue is idle draw. Most teams assume machines consume energy only when producing. In practice, a significant share of total site consumption often occurs during non-production periods, and building meters alone will never show you which machine is responsible.
A few practical points worth keeping front of mind:
Strokovni nasvet: Reconcile one full shift of logged energy data against your electricity invoice and a manual meter reading before you trust any KPI. This single validation step catches wiring errors, CT clamp orientation mistakes, and scaling factors before they corrupt weeks of data.
Mestric gives plant teams kWh per unit, cost per part, and idle-waste alerts inside the MES equipment model, alongside OEE, without exporting to spreadsheets. You get real-time production monitoring with energy as a first-class dimension: energy per work order, product-family heatmaps, and idle-draw alerts that fire within minutes of a condition occurring.

The pilot approach described above maps directly to how Mestric is deployed: connect your machines, validate one value stream, compute kWh per unit, and scale. The Trelleborg case study and the Magna Liberec results show what is achievable when machine-level data reaches the MES. If you want to see how Mestric handles your specific machine types and production context, book a demo or on-site presentation and bring your value stream map.


 069 763 552