


TL;DR:
- Manufacturing process optimisation requires systematic frameworks like Lean, Six Sigma, and TOC to achieve lasting improvements. Implementing end-to-end data visibility, digital tools, and stakeholder involvement ensures sustainable gains across the entire production chain. Digital twins and AI significantly accelerate results, especially in complex, high-mix environments, by enabling real-time decision-making and predictive insights.
Production lines grind to a halt. Rework piles up. Deadlines slip. These are not rare events for manufacturing managers; they are daily realities when processes run without systematic optimisation. Lean implementation has delivered lead time reductions of 33% and cost savings of 23% in documented manufacturing environments, yet many operations teams still rely on intuition and experience rather than structured methods. This guide gives you a clear, step-by-step path to systematic process optimisation, from selecting the right frameworks to deploying digital tools, so you can drive measurable, lasting results across your production floor.
| Point | Details |
|---|---|
| Start with clear goals | Defining your problem and desired outcomes is the essential foundation for effective optimisation. |
| Choose the right method | Lean, Six Sigma and TOC each solve different problems, and a hybrid often works best for complex processes. |
| Digital tools multiply impact | AI, digital twins and real-time data can accelerate and sustain measurable gains in efficiency and quality. |
| Avoid common pitfalls | Successful programmes rely on leadership support, robust data and a value-chain-wide approach rather than isolated fixes. |
| Sustain gains with integration | Long-term improvements come from integrating your efforts across the entire value stream, not just local areas. |
Before you can improve anything, you need to understand which approach fits your situation. Three frameworks dominate manufacturing process optimisation: Lean, Six Sigma, and the Theory of Constraints (TOC).
Lean targets waste elimination across seven categories, including overproduction, waiting, and excess motion, making it ideal when flow is your primary problem. Six Sigma addresses variation and defect rates using statistical tools, making it the right choice when quality consistency is the core issue. TOC focuses narrowly on identifying and removing the single biggest bottleneck in a production system, delivering fast throughput gains when one constraint is clearly limiting output. Many high-performing manufacturers use a hybrid approach, applying Lean for flow issues, Six Sigma for quality control, and TOC when one step is throttling the entire line.
The most widely used execution framework is DMAIC, which stands for Define, Measure, Analyse, Improve, and Control. DMAIC structures your project with five sequential phases: defining the problem and goals using a project charter and SIPOC diagram, measuring current performance through data collection and baseline setting, analysing root causes with tools like 5 Whys and FMEA, improving through pilot solutions and design of experiments, and controlling gains with standard operating procedures and statistical process control. This article follows that same sequence, so each section maps directly to a DMAIC phase.
Before starting, make sure you have these foundations in place:
Modern environments now add digital twins and AI-based simulation to this toolkit. These tools let you model changes virtually before committing resources, dramatically reducing pilot risk. They are particularly effective in high-mix, low-volume settings where physical trials are expensive and slow.
Pro Tip: Assign a named process owner on day one. Optimisation projects without clear ownership routinely stall at the Improve phase because no one has authority to push through changes. One person, one mandate.
| Framework | Primary focus | Best used when | Typical tool |
|---|---|---|---|
| Lean | Waste and flow | Slow cycle times, excess WIP | Value stream mapping |
| Six Sigma | Variation and defects | High rework or scrap rates | Control charts, FMEA |
| TOC | Bottleneck removal | One step limits all output | Drum-buffer-rope scheduling |
| Lean Six Sigma | Flow and quality combined | Both flow and variation issues | DMAIC with Lean tools |
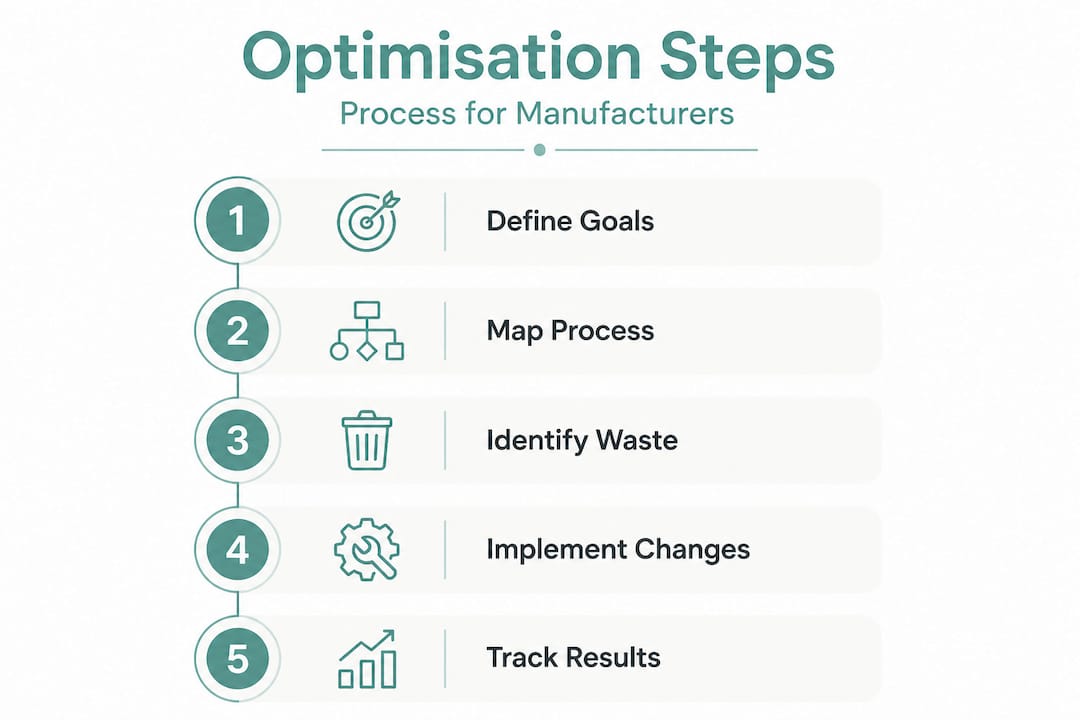
With your framework selected and your foundations prepared, here is how to execute each phase methodically. Follow this sequence to maintain discipline and avoid skipping steps that seem unnecessary but often matter most.
Define the problem clearly. Build a project charter that states the business case, the process scope, the target metrics, and the team members. Create a SIPOC diagram (Suppliers, Inputs, Process, Outputs, Customers) to map the high-level process and identify where value flows and where it breaks down. A poorly defined problem is the most common reason optimisation projects produce underwhelming results.
Measure current performance with precision. Collect data on cycle time, first-pass yield, Overall Equipment Effectiveness (OEE), and downtime frequency. Establish a documented baseline before any changes are made. This baseline is your reference point for proving that improvements are real and not statistical noise.
Analyse root causes, not symptoms. Use the 5 Whys technique to trace surface-level problems back to their origin. Apply Failure Mode and Effects Analysis (FMEA) to rank risks by severity, occurrence, and detectability. Construct a Pareto chart to identify which two or three causes account for 80% of your losses. For bottleneck identification, apply TOC thinking: find the one step where work queues build up and the downstream process is consistently starved.
Improve through controlled pilots. Test your solution on one line, one shift, or one cell before rolling out across the site. Use design of experiments (DOE) if you are adjusting multiple process variables simultaneously. Document every change, every result, and every unintended consequence. Follow the full streamline workflow guide to structure your pilot correctly.
Control the gains you have made. Write updated standard operating procedures (SOPs) and train operators to the new standard. Implement statistical process control (SPC) charts to detect drift before it becomes a defect or a downtime event. Schedule regular process audits to confirm the improvement is holding.
Documenting your baseline before any change is not optional. Without a clear before-and-after comparison, you cannot demonstrate ROI, cannot justify further investment, and cannot distinguish real improvement from normal process variation.
Comparison of frameworks by use-case:
| Scenario | Recommended approach | Key tools |
|---|---|---|
| Long lead times, excess WIP | Lean | Value stream mapping, Kanban |
| High defect or scrap rate | Six Sigma | Control charts, FMEA |
| One bottleneck limits throughput | TOC | Constraint analysis, drum-buffer-rope |
| Both flow and quality issues | Lean Six Sigma hybrid | DMAIC, VSM, SPC |
| Complex, fast-changing mix | Digital twins plus AI | Real-time simulation, ML scheduling |
A practical example: a component machining cell is producing at only 60% of planned throughput. Applying TOC, the team identifies that the deburring station is the constraint. Every other station waits on it. Rather than investing in general line balancing, they focus entirely on deburring: adding a second operator during peak periods, relocating tools to reduce motion waste, and implementing a pull signal to prevent upstream overproduction. Throughput increases by 22% within three weeks, without any capital expenditure.
Even well-designed optimisation programmes stumble. Knowing the most frequent failure modes helps you avoid wasting months of effort.
The most critical risk is siloed improvement. Optimising end-to-end value chains consistently outperforms local, siloed efforts. A common scenario: the machining department reduces cycle time by 15%, but because the quality inspection process remains unchanged, finished goods simply queue at inspection instead of reaching despatch faster. The local win disappears at the system level.
Watch for these red flags at each stage:
A statistic worth keeping in front of your team: documented Lean programmes have reduced lead times by up to 33% and operational costs by 23% in manufacturing environments, but these results are only achieved when the programme is executed end-to-end rather than as a series of isolated events.
Leadership buy-in is not a nice-to-have. When plant managers and operations directors are not visibly supporting optimisation, middle management often resists changes that disrupt their short-term productivity metrics. Optimisation takes time to deliver results, and without leadership patience, teams revert to old habits before gains stabilise.
Use the manufacturing optimisation checklist to audit your programme against each of these risk factors before and during implementation.
Pro Tip: Validate early wins in a contained pilot before scaling. A single success story from one production cell is more persuasive to sceptical managers than any theoretical business case. Use it deliberately to build momentum.
Manual methods and spreadsheet-based tracking have real limits, particularly in high-mix or fast-changing production environments. This is where digital tools stop being optional and start becoming a competitive necessity.

AI-driven optimisation has delivered efficiency gains of 20 to 50% in documented manufacturing deployments, a range that far exceeds what traditional Lean or Six Sigma alone typically achieves within comparable timeframes. Real-time data is the enabling factor: you cannot respond to a machine drift or a quality deviation in time if you are reading last week’s report.
Digital twins and AI are most effective in these specific scenarios:
Eaton’s manufacturing operation cut lead time by 39% using AI and digital twins in a high-mix environment, demonstrating that these tools are not limited to simple, repetitive production lines. The gains come from the system’s ability to simulate hundreds of scheduling permutations instantly, identify constraints that human planners miss, and adapt in real time as conditions change.
| Tool | Application | Measurable benefit |
|---|---|---|
| Digital twin | Schedule simulation and change validation | Up to 39% lead time reduction |
| AI-based OEE monitoring | Real-time performance tracking | 21 to 26 percentage point OEE gain |
| Predictive maintenance | Failure detection before breakdown | Reduced unplanned downtime by 15 to 30% |
| Recipe management software | Batch parameter control | Lower batch failure rates |
| MES with real-time dashboards | Full production visibility | Faster response to deviations |
Real-time data is the foundation of modern process optimisation. Traditional tools like Lean and Six Sigma identify problems that have already occurred. Digital platforms let you intervene before losses accumulate.
Explore AI’s role in optimisation in more depth to understand where these tools integrate with your existing production systems and which applications deliver the fastest return.
After working through hundreds of manufacturing improvement projects, one pattern is consistent: the programmes that stick are the ones that connect the entire production value chain rather than fixing isolated pockets.
Most optimisation efforts start well. A team identifies a genuine problem, applies the right framework, runs a successful pilot, and achieves a meaningful improvement in one area. Then, within six to twelve months, the gains erode. Operators revert to comfortable habits. New problems emerge upstream or downstream. Leadership attention moves on.
The reason is almost always the same: the improvement was local, but the process is systemic. If you reduce cycle time in machining without adjusting scheduling logic in production planning, the freed capacity fills with new WIP queues. If you cut defect rates in one cell without updating incoming inspection criteria, you are still absorbing the cost of upstream variation.
Sustainable optimisation demands that you share data and visibility across every function involved in the value chain. Quality, maintenance, production planning, procurement, and logistics all need to see the same real-time picture. When they do, decisions made in one area account for their effects on others. That is where process optimisation insights from connected systems prove most powerful.
There is also an uncomfortable lesson about stakeholder involvement. Most operations teams involve engineers and managers in the design phase and then hand changes to operators at implementation. This approach generates resistance because operators did not shape the solution. Involving the people who run the process from the earliest stages of the Define phase consistently produces better-designed solutions and faster adoption.
End-to-end dashboards, not local performance boards, are what create lasting accountability. When the whole organisation can see throughput, quality, and cost data in one integrated view, there is nowhere for inefficiency to hide. And when everyone owns the outcome together, improvements sustain themselves.
You now have the frameworks, the step-by-step structure, and the awareness of where digital tools make the biggest difference. The next move is yours.
Mestric™ gives manufacturing and operations teams the real-time production visibility and AI-powered analytics needed to put every step of this guide into practice. From live OEE tracking and downtime analysis to quality monitoring and cost reporting, all connected directly to your machinery, Mestric transforms the optimisation process from a manual exercise into a continuous, data-driven programme. Get your step-by-step guide to see how structured digital support maps to each DMAIC phase. You can also compare MES vs. traditional manufacturing methods to understand where the biggest efficiency gaps lie, or streamline operations now with a tailored approach to your production environment.
Define the problem and set clear, measurable process goals using a structured approach like DMAIC, starting with a project charter and SIPOC diagram to scope the work accurately.
Lean suits waste and flow problems, Six Sigma addresses variation and defect rates, and TOC is most effective when one specific bottleneck is visibly limiting total throughput across the production system.
Lead times and costs typically drop by 20 to 60% in well-executed programmes, with quality improvements and OEE gains often following as secondary benefits once flow and variation are addressed.
AI and digital twins provide real-time monitoring, predictive insights, and scheduling intelligence that can improve efficiency by 20 to 50%, particularly in high-mix or complexity-driven manufacturing environments.
Siloed approaches and weak data foundations are the most frequent causes, compounded by insufficient leadership commitment to sustaining changes once the initial project team has moved on.


