


TL;DR:
- Unplanned downtime costs the world’s top companies approximately 11% of annual revenue annually.
- Effective downtime analysis connects equipment failures to business outcomes, enabling proactive improvements.
- Comprehensive review of downstream effects and asset criticality leads to more accurate capacity loss measurement.
Unplanned downtime is not simply a technical inconvenience. It is a direct drain on revenue, capacity, and competitive advantage. Unplanned downtime costs the world’s 500 largest companies roughly 11% of annual revenues, totalling an estimated $1.4 trillion every year. Yet many manufacturing executives still treat downtime as an operational problem to be solved on the shop floor rather than a strategic priority to be managed at the boardroom level. This guide will show you how to change that thinking, apply proven analysis methods, and turn downtime data into measurable business improvements.
| Point | Details |
|---|---|
| Downtime defines profitability | Effective analysis of downtime directly impacts manufacturing revenue and operational success. |
| OEE and Pareto go hand in hand | Using OEE with Pareto charts is essential for pinpointing primary downtime causes and improvement areas. |
| Edge-case losses are critical | Hidden impacts like quality holds and maintenance delays can escalate losses beyond simple breakdowns. |
| Continuous improvement is key | Minimising downtime is an ongoing process powered by data tracking, benchmarking, and technology adoption. |
Now that we have seen the financial stakes, let us clarify what downtime analysis truly means for manufacturing leaders.
Production downtime analysis is the practice of measuring, categorising, and explaining periods when manufacturing assets are not producing, then translating those losses into actionable reliability and operational improvements. It is not simply logging when a machine stops. It is a structured process that connects equipment behaviour to business outcomes.
Downtime falls into two broad categories:
Understanding the difference matters because each category requires a different response. Planned downtime can be optimised through scheduling and lean changeover techniques. Unplanned downtime demands root cause analysis, predictive maintenance, and rapid response protocols.
The business impact of downtime connects directly to three core performance areas:
| Performance area | How downtime affects it | Typical measurement |
|---|---|---|
| Availability | Reduces the proportion of scheduled time assets are running | OEE Availability % |
| Throughput | Cuts the number of units produced per shift or day | Units lost per hour |
| Cost | Increases cost per unit and reduces revenue potential | £ lost per downtime event |
Overall Equipment Effectiveness, commonly known as OEE, is the standard framework for capturing these losses. OEE multiplies Availability, Performance, and Quality into a single score. A world-class OEE sits at around 85%, yet many manufacturers operate between 40% and 60%, leaving significant capacity on the table. Defining production downtime precisely is the first step towards closing that gap.
“The value of downtime analysis is not in the data itself. It is in the decisions that data enables.”
When you move from recording stops to understanding why they happen and what they cost, you shift from reactive firefighting to proactive management. That shift is where real operational gains are made.
With clarity on what downtime analysis encompasses, let us explore the tools and methodologies executives rely on to break down and address losses.
A core methodology for downtime analysis is to focus on unplanned downtime hours as an Availability driver in OEE, then decompose by cause and asset or shift to prioritise improvement actions. This structured approach prevents teams from chasing every individual stop and instead focuses effort where it will have the greatest impact.
Here is a practical step-by-step process for applying this methodology:
Pro Tip: When building your Pareto chart, include both frequency and duration for each downtime reason. A fault that occurs 50 times but lasts two minutes each time may be less damaging than one that occurs five times but stops production for 40 minutes. Sorting by total minutes lost, not event count, gives you a more accurate picture of where to focus.
Following these production optimisation steps consistently transforms downtime data from a passive record into an active management tool. The methodology is not complicated, but it does require discipline and the right systems to collect reliable data at scale.
Next, let us see how downtime analysis connects to bigger business outcomes and why nuance matters when calculating true losses.
Executives who track downtime at the scorecard level understand that unplanned downtime benchmarks represent more than operational inefficiency. They represent lost revenue, missed delivery commitments, and reduced customer confidence. When downtime analysis is integrated into executive reporting, it becomes a lever for decisions about capital investment, maintenance strategy, and workforce planning.
The most impactful business outcomes linked to effective downtime analysis include:
However, nuance matters here. Edge-case handling matters because downstream effects like quality holds, changeover overruns, or waiting maintenance can inflate real capacity loss even when a single machine’s mechanical failure is the visible trigger. This is a critical point that many standard downtime reports miss entirely.
Consider a practical example. A packaging line stops for 15 minutes due to a sensor fault. The sensor is repaired and the line restarts. The downtime report records 15 minutes of mechanical downtime. But the quality team placed a hold on 200 units produced in the minutes before the fault was detected. The maintenance team took 10 minutes to arrive because they were attending another asset. The line then ran at reduced speed for 20 minutes while the operator verified stability. The true capacity loss is closer to 60 minutes, not 15.

Monitoring quality impact alongside downtime events is therefore essential for an accurate picture. Incorporating flexible drive system benefits into equipment design can also reduce the frequency of mechanical stops that trigger these cascading losses.
Pro Tip: Build a “true loss” calculation into your downtime reporting. For every recorded stop, capture the associated quality hold duration, maintenance response time, and speed recovery time. Sum these alongside the mechanical stop time to get an accurate picture of total capacity loss per event.
“The machines that stop the most are rarely the ones costing you the most. Look downstream before you act.”
With a clear grasp of business outcomes, here is how you can actively minimise downtime and drive operational efficiency across your facilities.
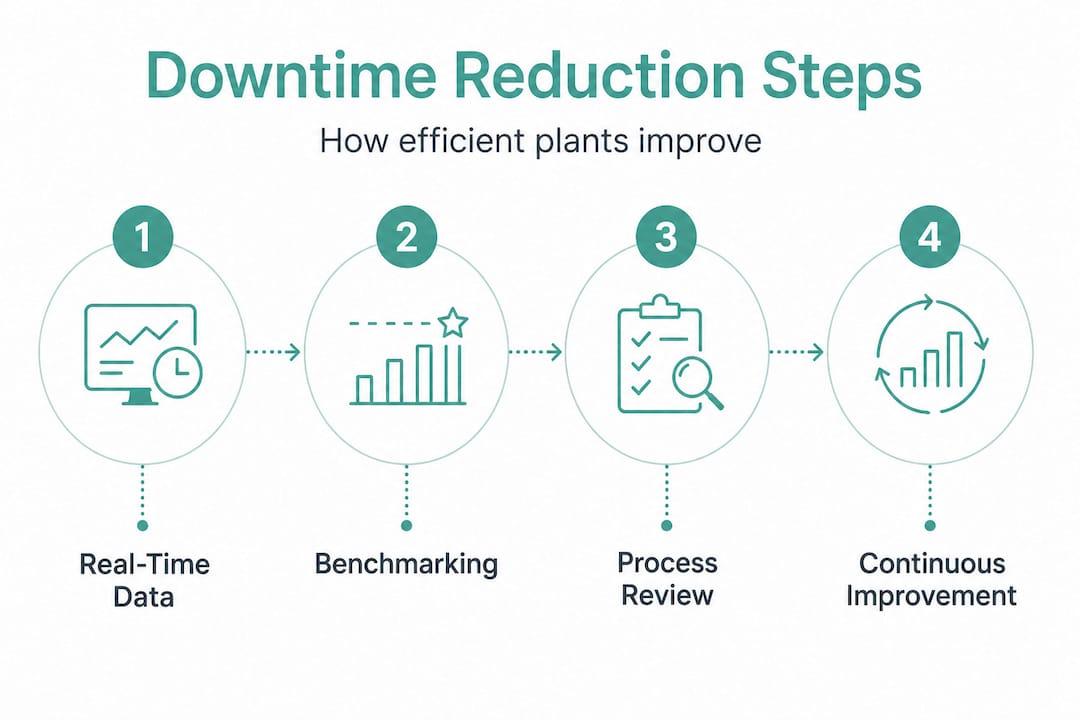
Effective downtime reduction is built on three pillars: real-time visibility, structured benchmarking, and continuous improvement. Each pillar reinforces the others, creating a cycle of sustained performance gains.
Translating downtime losses into actionable reliability improvements requires more than a spreadsheet. Modern manufacturing environments generate data at a pace that manual processes cannot keep up with. Real-time monitoring systems connected directly to equipment provide the granular, time-stamped data that makes accurate analysis possible.
Here are the key strategies to implement:
A useful starting point is a structured productivity checklist that aligns your team around the key inputs to downtime reduction. Pairing this with data-driven efficiency tips ensures that your improvement actions are grounded in evidence rather than assumption.
Insights from precision manufacturing environments also highlight how equipment design choices influence downtime frequency. Selecting components with higher mean time between failures (MTBF) reduces the underlying rate of mechanical stops, complementing the analytical work your team is doing.
The compounding effect of consistent improvement is significant. A facility that reduces unplanned downtime by just 10% across its key assets can recover hundreds of production hours per year. At typical throughput rates, that translates directly into additional revenue without any increase in fixed costs.
Having reviewed strategies, let us reflect on what many executives overlook in their drive for downtime reduction.
Most downtime programmes focus on the visible trigger. A machine fails, a stop is recorded, a repair is made, and the event is closed. The Pareto chart shows mechanical failures as the top cause, and the maintenance team receives more resources. This is logical, but it is often incomplete.
The deeper issue is that downstream effects like quality holds, changeover overruns, or waiting maintenance can inflate real capacity loss far beyond what the initial stop record shows. When executives rely solely on reported downtime minutes, they are making decisions based on a partial picture.
The executives who achieve the greatest gains from downtime analysis are those who insist on reason families that capture the full chain of events, not just the first trigger. They ask: what happened after the stop? How long before production was truly stable again? What was the quality impact? These questions reveal the hidden losses that standard reports obscure.
There is also a tendency to focus on the assets that stop most frequently rather than the assets that cost the most when they stop. A bottleneck asset that stops for 30 minutes costs far more in lost throughput than a non-bottleneck asset that stops for two hours, because the bottleneck determines the output rate of the entire line. Downtime analysis must be weighted by asset criticality, not just stop frequency.
Rethinking performance through this lens often reveals that cost-saving tactics are hiding in plain sight. The data is already there. The challenge is asking the right questions of it.
Our view is that downtime analysis should be treated as a financial discipline, not just an operational one. When your analysis connects every stop to a revenue figure, every improvement action carries a clear return on investment. That is the level of rigour that turns downtime analysis from a reporting exercise into a genuine driver of business performance.
Downtime analysis gives you the evidence to make smarter decisions, but the real gains come from having the right systems in place to act on that evidence continuously.
Mestric™ connects directly with your manufacturing equipment to capture real-time downtime data, reason codes, and performance metrics across every asset and shift. Our MES platform translates raw data into clear dashboards that support both shop floor decisions and executive reporting. If you are evaluating your current approach, start by exploring how MES compares to traditional manufacturing systems and what the transition looks like in practice. You can also discover practical ways to streamline production operations and review the types of manufacturing software available to support your digital transformation journey.
Production downtime is grouped into planned stops such as maintenance or changeovers, and unplanned events such as mechanical failures or quality holds. Each category requires a distinct management approach.
Key tools include time bucket tracking, Pareto charts for cause analysis, and a minutes bridge to convert stops into lost productivity or revenue. Pareto charts and minutes bridge together allow teams to prioritise the causes with the greatest financial impact.
Unplanned downtime costs the world’s 500 largest companies about 11% of annual revenues, totalling roughly $1.4 trillion each year. This figure underscores why downtime is a boardroom priority, not just a shop floor concern.
Edge-cases are less obvious events such as quality holds or maintenance delays which can inflate losses beyond the initial visible trigger like a machine failure. Downstream capacity losses from these events are frequently underreported in standard downtime logs.
By identifying loss patterns and root causes, executives can target operational improvements that boost reliability and profitability. Translating losses into improvements is the core purpose of a structured downtime analysis programme.


