

Cost analysis by workstation means assigning to each production workplace the resources it actually consumes (labour, machine time, material, energy, maintenance and a fair share of overheads), then comparing planned, actual and unit costs. Done well, it shows you which workstations make money, which lose it through downtime or scrap, and where an improvement euro goes furthest. This guide walks through what to include, how to allocate shared costs, a worked example and how to keep the analysis current without a monthly spreadsheet marathon.
A workstation, or in accounting terms a cost centre, is a place where work is done and costs arise: a CNC machine, an SMT line, a packing cell, a manual assembly bench. Cost analysis by workstation collects the costs that arise there and compares them with the plan and with the output.
This is not a new idea in Slovenia. A University of Maribor diploma thesis on the method of analysing workplace costs links workplaces and cost analysis directly to cost price, selling price, profit and loss. The national higher vocational accounting programme also covers monitoring costs by cost centres and cost objects, including in manufacturing organisations, together with static and flexible budgeting, internal reporting and responsibility accounting for organisational units.
In practice, the analysis supports five kinds of decision:
Start by separating costs you can trace to the workstation from costs you must share.
These are traced to the workstation from records, with no estimate needed:
These serve several workstations and need an allocation key:
The way you treat these costs matters for reporting. The Slovenian Accounting Standards 2024 state that selling and general-service costs are recognised in the period and are not retained in inventory value. They also describe product cost values ranging from variable manufacturing costs to a narrowed full cost. So decide which cost level your workstation analysis reports, and keep it consistent with how finance values inventory. For internal decisions many plants show both: a variable view for short-term choices and a full view for pricing.
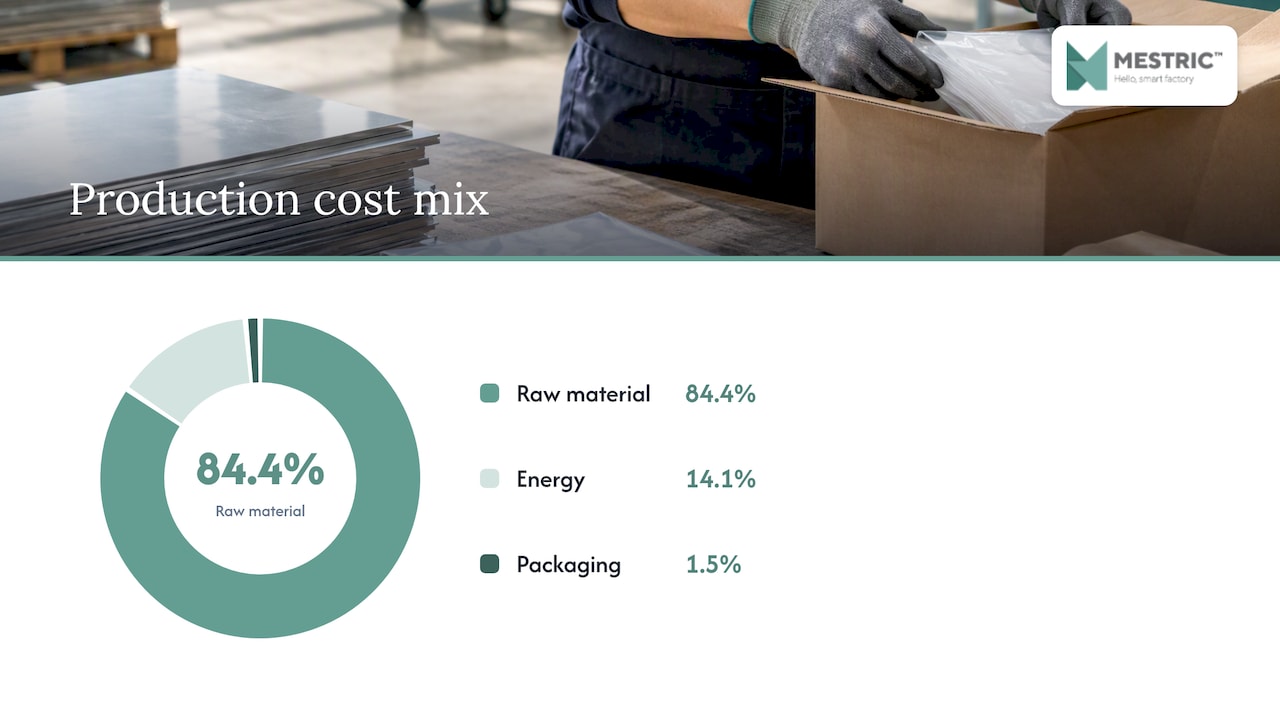
The cost mix also tells you where to look first. In its 2024 annual report, Cinkarna Celje reports a production-cost structure of 84.4% raw material, 14.1% energy and 1.5% packaging. That is a chemical producer, so your plant will look different. But it shows why you should check which cost group dominates before spending effort on the others. In a machining cell, machine time and labour often matter more than material. In a process plant, material and energy can dominate.
There are three common approaches, and the choice depends on how different your workstations are.
| Method | How it allocates | Works best when | Watch out for |
|---|---|---|---|
| Traditional (one rate) | Overheads spread by one base, such as labour hours or machine hours | Few products, similar routings | Over-generalises costs and fits complex processes poorly |
| Activity-based costing (ABC) | Overheads assigned by the activities that cause them | Varied products, large overhead share | More data and maintenance effort |
| Time-driven ABC (TDABC) | Capacity cost rate multiplied by the time each task takes | Complex routings with measurable times | Needs reliable time data |
A 2025 University of Maribor master’s thesis compares traditional, ABC and TDABC costing in a Slovenian manufacturing company. It reports that traditional allocation is simple and widely used but can over-generalise costs and fit complex processes poorly. That matches what we see in plants: a single plant-wide overhead rate makes a simple manual bench and a heavily automated line look alike, when they are not.
A practical rule: choose allocation keys that reflect a real cause.
Write the keys in a short document, and change them only at a fixed review date. Otherwise, the comparison between months becomes meaningless.
Before you calculate anything, check that you can answer these questions for each workstation:
The Slovenian practical case of ETA Cerkno, a University of Ljubljana thesis on redesigning the cost-accounting system for manufacturing calculations, is a good reminder that the accounting structure and the shop floor data must be designed together. Cost centres that do not match how work is organised produce numbers nobody trusts.
Questions 1 to 3 are where manual collection fails first. Paper downtime logs are filled in at the end of a shift, with rounded times and vague causes. If you want a defensible figure, connect the machines and capture states automatically. Our guide to calculating production capacity shows how to use the same time data to see available hours per station.
The figures below are illustrative, not from a real plant. They show the logic.
A CNC workstation is scheduled for 160 hours in a month. Of these, 22 hours go on unplanned stoppages and 18 hours on setup and changeovers, so it produces for 120 hours.
| Cost item | Monthly cost |
|---|---|
| Operator labour (loaded) | €4,800 |
| Depreciation | €2,400 |
| Energy | €900 |
| Maintenance (allocated by hours booked) | €700 |
| Tooling and consumables | €1,100 |
| Floor space and shared overhead | €1,000 |
| Total | €10,900 |
The quote for a job should use the productive-hour figure, or a realistic utilisation assumption, not the scheduled-hour one. If you price at €68.13 and the workstation only produces 75% of the time, every job quietly loses margin.
Now the useful part. Of the 40 lost hours, 22 were breakdowns. If a single recurring fault explains half of them, that is 11 hours, or about €750 a month at the scheduled-hour rate, before counting the lost output. That number tells you what a fix is worth and how much you can reasonably spend on it. To value the lost output as well, see how to build a defensible per-hour downtime cost.
A table of workstation costs is not yet an analysis. Compare in four directions.
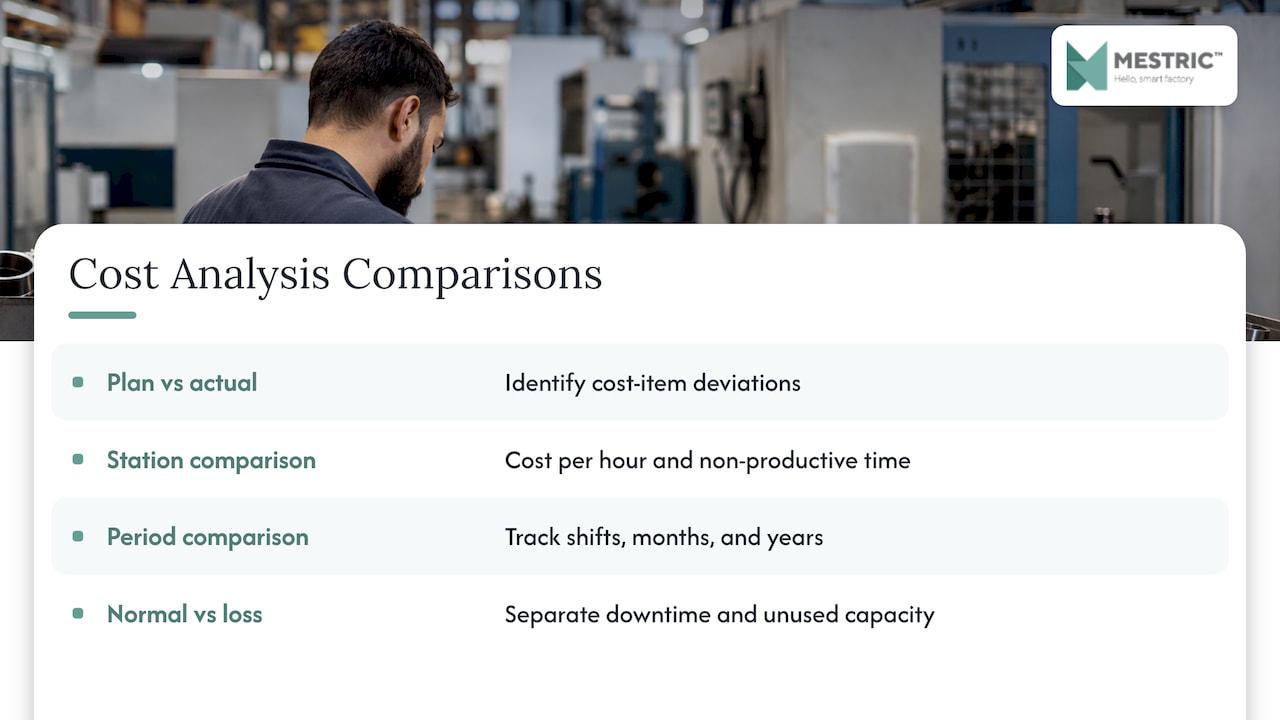
Plan against actual. Which cost items deviate, and by how much? A deviation in energy points to a different cause than one in tooling.
Station against station. Compare similar workstations on cost per productive hour and on the share of non-productive time. A big gap between two identical machines usually points to a process or maintenance difference, not to the machines.
Period against period. Track the trend by shift, month and year. The IMA article on manufacturing disruptions notes that disruption cost can be viewed by shift or year and by cause, such as equipment failure or human error. That lets you compare workstation performance and weigh the cost of disruption against the cost of preventing it. Its perspective is that this moves plant-floor decisions from intuition to priorities based on economic consequences.
Normal cost against loss cost. A manufacturing ABC case study reports that regularly updated production-line data can separate normal production costs from the cost of downtime and unused capacity. It also reports that model accuracy depends on the accuracy of the input data. The same study allocated electricity, natural gas, compressed air and other resources to the responsible stations, then used the results for maintenance prioritisation, labour or buffer-space decisions and longer-term improvement projects.
A Pareto chart of lost hours or lost euros by cause, per workstation, is usually the fastest way to decide what to tackle first. Our guide on production downtime analysis explains how to build one, and defining production downtime helps you agree on categories before you start counting.
For the wider method, see our cost analysis guide for factories and the step-by-step production optimisation guide. The first step of assessing current workflows and data is a good checklist for what you have today.
Most plants we talk to do not lack a costing method. They lack trustworthy data at workstation level. The accountant has the ledger, the supervisor has a feeling about which machine causes trouble, and nobody has the same numbers.
We built Mestric around closing that gap. When machines report their own states, output and quality parameters, downtime stops being an estimate. The cost per productive hour, the loss by cause and the comparison between shifts then come from the same live data that production managers already use to run the floor.
Our view is that cost analysis should not be a quarterly project. It should be a view you open on Monday morning, with KPIs, downtime and quality in one place, so decisions about maintenance, staffing and process norms are made while they still matter.
Andraž
If your cost figures still depend on shift logs and end-of-month spreadsheets, a Manufacturing Execution System can feed them directly. Mestric™ MES connects to your equipment, collects data automatically and shows performance, downtime, quality parameters and cost analysis in real time, with AI-powered tools to support optimisation. You can see it working on connected machinery in a real production environment through our on-site demonstration.
To see how data collection fits into your processes, read how to integrate a digital MES with your equipment, or how real-time production monitoring changes daily decisions.
Monthly is a sound minimum for cost per hour and plan-against-actual comparisons, since it matches the accounting close. Downtime, scrap and utilisation are better watched daily or per shift, because that is when you can still act on them. Keep allocation keys fixed between review dates.
Use both. The scheduled-hour figure shows what the workstation costs to keep available. The productive-hour figure is the one to use for quotes and profitability, because it includes the cost of setup, stoppages and idle time. The gap between them is your improvement potential.
Not always. A single machine-hour rate per workstation is a good start if your products and routings are similar. Move to activity-based or time-driven costing when overheads are a large share of cost and your products load the workstations very differently.
Input data. Manually recorded stoppage times, missing causes and unrecorded scrap distort the result, and no costing model can correct that. Automatic collection from the machines is the most direct fix.


 069 763 552