


MES ROI is real, and it is measurable: the return comes almost entirely from three levers, unplanned downtime, scrap and rework, and labour or reporting time recovered. Cloud deployments typically pay back within months; on-premise projects take longer to reach the same point. Before you trust any figure, including one from Mestric, measure your own baseline first.
TL;DR:
- The most significant MES value comes from reducing unplanned downtime, scrap, rework, and automating manual reporting processes, which can be measured precisely.
- Cloud-based MES deployments typically deliver faster payback periods, often within several months, compared to on-premise projects that may take 12 to 24 months to break even.
- Building a CFO-ready business case requires measuring actual baseline performance for a full month, applying conservative improvement estimates, and including detailed total cost of ownership for three years.
- Most business cases fail due to unrealistic assumptions, unverified statistics, or neglecting the time needed for training and data stabilization before benefits begin.
- Using real-time KPI tracking and automation tools, like Mestric, aligns with the five financial layers of MES ROI and accelerates value realization through faster deployment and early visibility.
MES ROI is the financial return a Manufacturing Execution System generates once its operational improvements, fewer stoppages, less scrap, faster reporting, are converted into figures a finance team will actually accept. That conversion is where most MES business cases fall apart. A production manager reports “we cut changeover time by 20 minutes” and a CFO hears nothing, because 20 minutes is not a financial line item. It needs to become a number that reduces cost, defers capital spending, or lowers risk exposure.
A useful way to structure that translation is a five-layer framework, first laid out clearly in Tulip’s ROI methodology, which maps every operational metric onto one of five financial categories.
Before you present a single KPI to procurement or the board, check that it maps cleanly to one of these five layers. If it does not, it is an interesting statistic, not a business case.
Nearly all recoverable MES value sits in three levers, according to the worked breakdown in Symestic’s MES ROI calculator, which finds these three categories typically account for the large majority of financial benefit. Each has a formula you can run with numbers you likely already have somewhere in a spreadsheet, a SCADA export, or a supervisor’s notebook.
Sum the three, subtract your annual MES cost (subscription fees plus implementation cost amortised over the contract term), and you have your net annual benefit. Divide the implementation cost by the monthly net benefit and you get your payback in months.
The inputs matter more than the formula. Capture downtime hours and cost per hour from your existing maintenance logs, not estimates; measure scrap cost from your quality system over at least a full production cycle; and calculate your fully loaded labour rate with benefits and overhead included, not just wages. Guessing any of these three numbers is the single fastest way to produce a business case finance will reject on sight.
Pro Tip: *Run the calculation twice, once with your current best estimate and once using only measured data from the last 30 days.
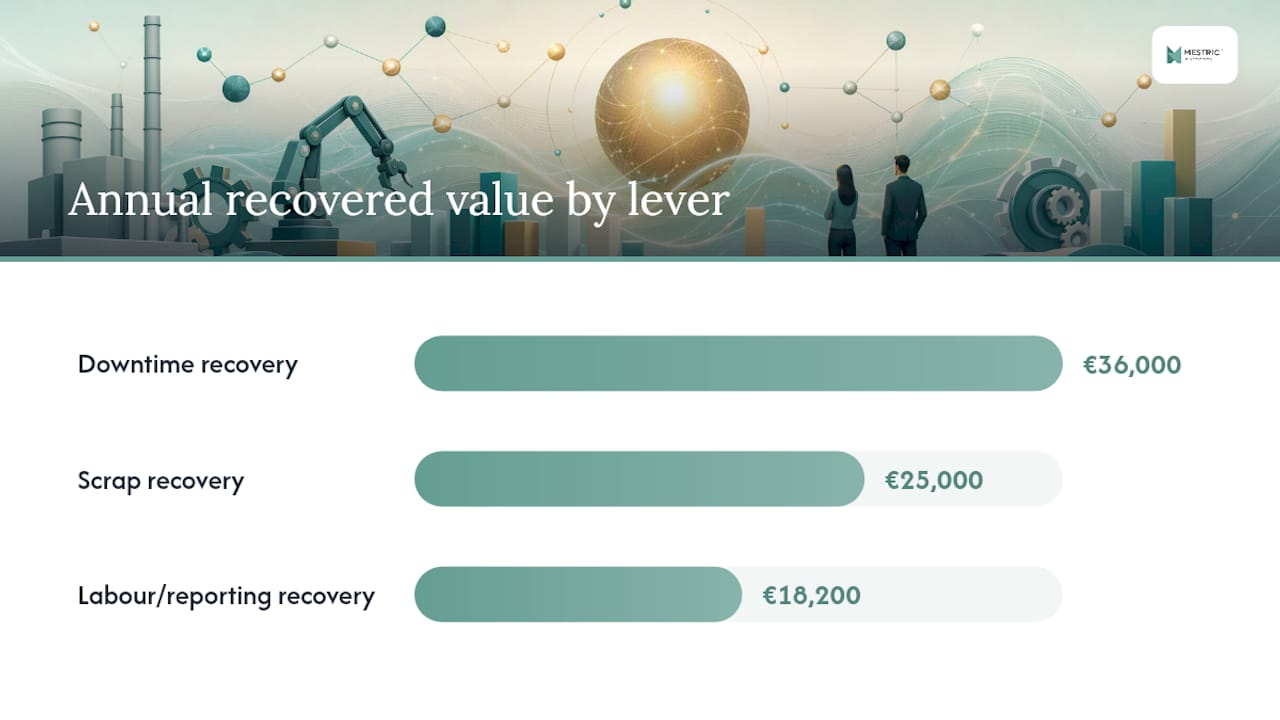
These figures combined suggest a total annual benefit valued in the tens of thousands of euros. Against a typical cloud MES cost in the tens of thousands of euros, a payback period of several months is common, consistent with the faster break-even that cloud MES deployments tend to produce over on-premise builds.
Payback stretches to around thirteen months. That sensitivity check is not optional. It is the difference between a business case that survives a CFO’s scrutiny and one that collapses the moment someone asks “what if we’re wrong by half?”
One phenomenon worth modelling explicitly: OEE often drops in week one after go-live, not because the line got worse, but because you are finally measuring accurately instead of estimating optimistically. Build that into your baseline expectations, or an early dip will look like project failure when it is actually the first honest number you have had.

Time-to-value is a multiplier on your entire business case, not a footnote. A benefit that arrives in month two is worth considerably more in net present value terms than the identical benefit arriving in month fourteen, and the deployment model you choose largely determines which of those you get.
Cloud MES platforms generally reach first value faster and carry lower upfront capital cost, because there is no on-site server infrastructure to provision and configure. On-premise deployments often demand longer integration windows with existing automation layers, which pushes the break-even point out, sometimes into the 12 to 24 month range for larger rollouts, per the range of outcomes documented across MES implementation case data. Neither model is universally correct. A highly regulated process manufacturer with rigid change control may need the longer on-premise runway; a discrete manufacturer wanting a fast pilot on one line usually does not.
When you build your NPV model, resist the temptation to assume benefits start on day one. A more defensible approach models benefit accrual starting at month three to six, giving the organisation time to train users, stabilise data collection, and get past that week-one OEE dip. Two figures worth comparing side by side in your own model:
That last point deserves its own line item. Internal effort, the hours your automation engineers and shift supervisors spend on configuration, testing, and training others, is real cost even when no invoice arrives for it. Leaving it out understates your TCO and makes the eventual payback look better than it will actually be.
Most MES business cases do not fail because the technology underperforms. They fail because the financial model was never credible in the first place.
Pro Tip: Get finance in the room before you finalise a single number. A CFO who helped define “downtime cost per hour” will defend that figure in a budget meeting; a CFO who first sees it in your final slide deck will pick it apart instead.
A defensible MES business case follows a sequence, not a single spreadsheet built in an afternoon.
That fourth deliverable is the one most teams skip, and it is the one that gets a business case approved. A CFO does not need to agree with every assumption. They need to see that you made the assumptions explicitly, rather than burying them inside a formula they cannot audit. Streamlining the underlying production process before you finalise your baseline numbers also tends to make the whole case tighter, since you are not modelling savings against a process you are about to change anyway.
Mestric was built around the same five layers this framework describes, not retrofitted to match them afterwards. Real-time KPI tracking and machine integration feed the direct cost and hidden factory layers directly, surfacing scrap trends and micro-stops that manual reporting typically misses entirely. Automated data collection removes the manual reporting hours that sit inside the labour elasticity calculation, and AI-powered optimisation tools shorten the time-to-decision layer by flagging quality drift before it becomes a customer complaint.
On implementation, Mestric leans towards the faster end of the time-to-value spectrum: cloud-based deployment avoids the on-site infrastructure delays that stretch on-premise projects, and an onsite demonstration lets your team see the connection to real machinery before committing to a full rollout. That combination, easy implementation plus visible baseline data early, is precisely what makes the conservative payback modelling in this article achievable rather than theoretical.
The MES business cases that survive contact with a CFO share one habit: they measure before they model. Teams that skip the 30-day baseline almost always overstate their downtime reduction, because memory is optimistic and spreadsheets inherited from a vendor deck rarely match your actual shift patterns.
The second habit is patience with time-to-value. Modelling benefits starting at month one instead of month four is the single most common way I have seen a good case get rejected for looking too good to be true. If you want a second opinion on your numbers before you present them, run them past whichever vendor you are evaluating, including us, and ask them to stress-test your assumptions rather than validate them.
— Andraž
Every formula in this article works on a spreadsheet, but a live business-case workshop with your actual production data will surface things a generic template cannot, your specific baseline OEE, your real scrap categories, the reporting hours your shift supervisors actually lose every week. Mestric offers exactly that: an onsite demonstration connected to your machinery, alongside a customised ROI workbook built from your numbers rather than industry averages.

If you are weighing MES options against what you run today, see how a Mestric deployment compares to traditional manufacturing setups on time-to-value and total cost. When you are ready to test your own figures, book a real-time production monitoring demo and leave with a payback estimate built from your plant’s actual data, not a vendor average.


 069 763 552