

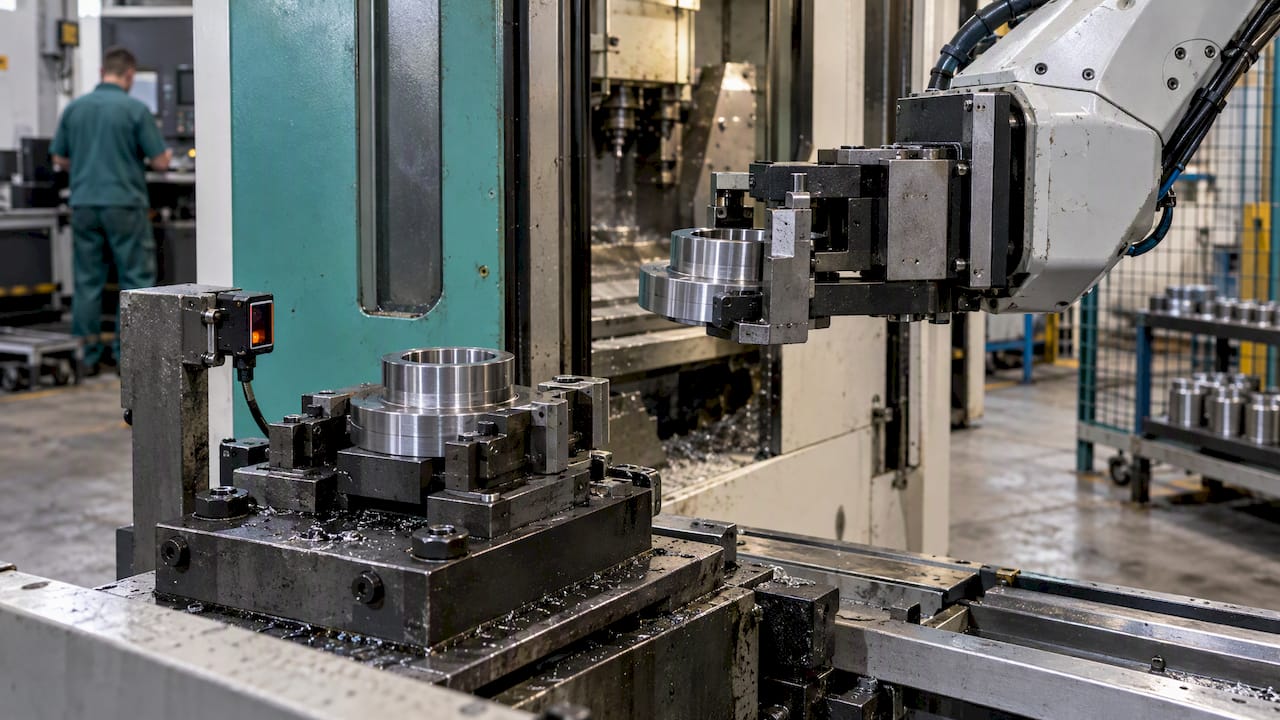
Manufacturing cycle time is the time needed to produce one part or complete one process step, measured from a defined start event to a defined finish event. The fastest way to get reliable numbers is to capture timestamped start and finish events rather than relying on a stopwatch alone, and to automate that capture wherever possible. We build Mestric™ as an MES that logs these events continuously, turning raw timestamps into comparable KPIs.
TL;DR:
- Compare machine runtime with takt time, which equals available production time divided by customer demand; include loading, unloading, and changeovers when estimating effective capacity.
- For manual checks, define exact start and finish events, repeat measurements across representative parts, and record stoppages, setup, scrap, and rework separately.
- Automated capture should log part identifiers, start and completion timestamps, setup or run state, good and reject counts, and uptime or downtime directly from equipment.
- Store timestamped event logs, synchronize machine clocks, and validate signal definitions with periodic manual spot checks, especially after equipment, fixture, or program changes.
- Use cycle time distributions rather than averages alone to distinguish outliers from persistently slow stations, then rebalance workloads, apply SMED, or target maintenance.
Getting the terminology right matters, because mixing these terms up leads to the wrong fix for the wrong problem. Cycle time is the time to produce a part or complete a process; it comes in several flavours depending on what you are measuring.
Takt time is different again: it is available production time divided by customer demand, so a line with typical production time and demand has a takt time indicating the target rhythm for output, from the Lean Enterprise Institute. Comparing measured cycle time against takt time tells you whether a process is keeping pace with demand or quietly falling behind, which is a very different question from whether a machine is simply running slowly.
Manual measurement still has a place, particularly for spot checks or before any sensors are installed. The discipline that makes it useful is defining your start and finish events precisely and applying them the same way every time.
Pro Tip: Keep a running log of which cycles included a stoppage or rework, so a slow average does not get blamed on the wrong cause.
Manual sampling tells you what happened in a handful of cycles. Automated collection tells you what happened in every cycle, which is the only way to see rare but costly events like intermittent stoppages. The signals worth capturing from each machine or workstation are consistent regardless of industry.
An OPC-based implementation can distinguish setup from machining by monitoring program load and run signals, which allows start time, end time, setup time, machining time and part counts to be calculated automatically rather than estimated by hand. Time synchronisation across machines matters here: if one controller’s clock drifts, cross-line comparisons and bottleneck analysis both suffer.
Storing these as timestamped event logs, rather than only as rolling averages, is what supports traceable KPIs, as ISO/TR 22400-10 recommends when it calls for deriving KPIs from work-unit event logs and operational sequences. An event log preserves the reason a cycle ran long, whether that was a fault, a wait or a changeover, instead of burying it inside a single number.
Even a well-instrumented line produces misleading cycle-time figures if the underlying definitions are sloppy. A few errors show up repeatedly.
A useful validation routine runs manual spot checks against the automated log periodically, checks that timestamps are sequential and plausible, and audits signal definitions whenever a machine, fixture or program changes. NIST’s recommendations for manufacturing data point out that dashboards alone are not enough; the KPIs are only as good as the defined, validated signals feeding them.
Pro Tip: Write down your event definitions once, in plain language, and attach them to the dashboard so a new engineer interprets the same cycle-time figure the same way a year later.
Once the numbers are reliable, the real value comes from acting on them quickly rather than reviewing them once a month.
This is where production optimisation stops being a reporting exercise and starts changing how the shift actually runs.
Manual sampling and spreadsheets can get a line started, but neither scales to every machine, every shift, every part number. An MES such as Mestric™ is built to log every cycle automatically and present it as a live KPI rather than a weekly export.
A typical pilot connects one line first, confirms the start and finish signals against a short run of manual samples, then rolls the validated dashboard out to the rest of the plant. The usual result is fewer manual checks, faster identification of which station is actually the bottleneck, and fewer manual recording errors feeding the KPI.
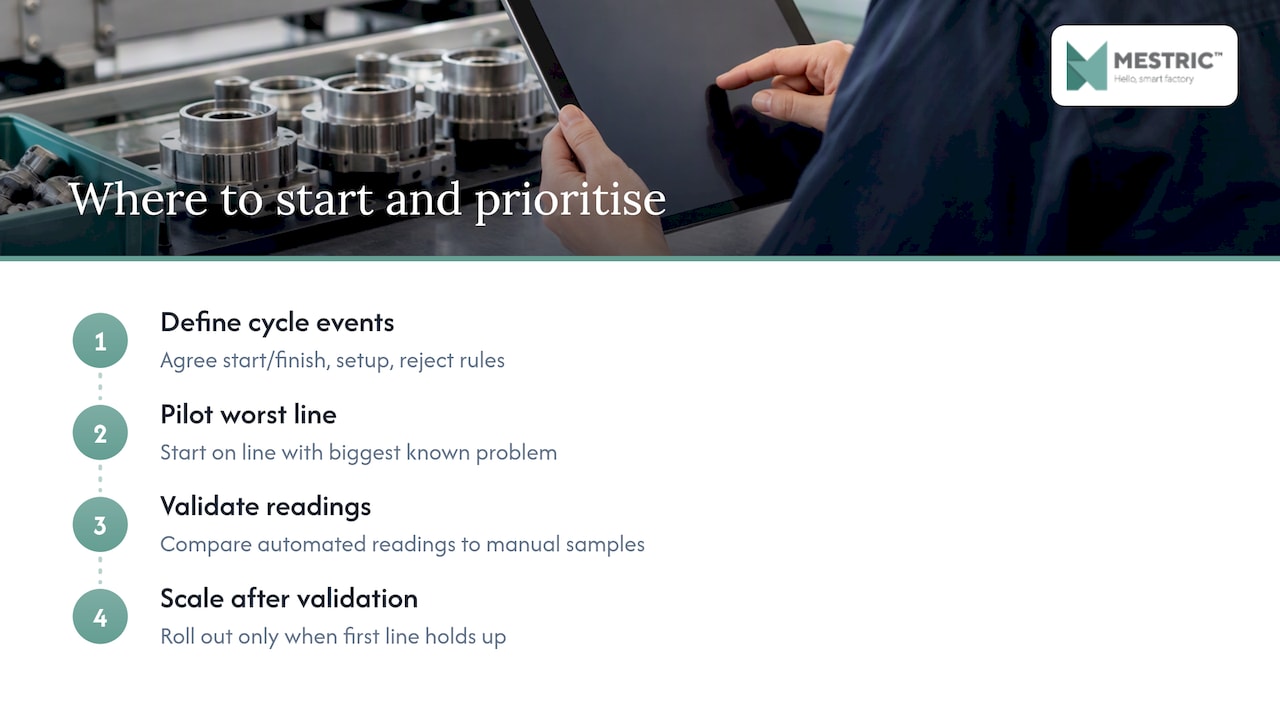
Before automating anything, define your events. Agree, in writing, what marks the start and finish of a cycle, what counts as setup, and how a reject is logged, because automation only gets you consistent bad data if the definitions underneath it are inconsistent.
Once definitions are fixed, pilot on the line with the biggest known problem rather than the easiest one to wire up. Validate the automated readings against a short run of manual samples before trusting the dashboard, then scale to the rest of the plant only once the first line’s numbers hold up under scrutiny. Measurement discipline earns you the right to automate; automation without it just produces a faster wrong answer.
— Andraž
We built Mestric™ MES around the principle that cycle time should be measured once, automatically, and trusted by everyone who looks at the dashboard afterwards. Connected directly to your equipment, it captures cycle start and completion events, setup time, reject counts and uptime states as they happen, and turns them into KPIs your team can act on the same shift.
For readers comparing peripheral automation alongside measurement, partners like JIENCO’s cobot palletising cells illustrate how hardware changes at the end of a line also shift cycle-time patterns worth tracking.
The most practical next step is a demonstration on a real line: request a Mestric™ demo and we will show you how event logging and live KPIs work on equipment similar to yours.
Cycle time is how long it actually takes to produce one part or complete one process step, while takt time is the pace demand requires, calculated as available production time divided by customer demand. Comparing the two tells you whether the line is keeping pace with demand or falling behind it.
There is no single fixed number, but the Lean Enterprise Institute recommends measuring across several representative units rather than a single cycle, since one reading rarely reflects normal variation. Repeated sampling catches the effect of setup, minor stoppages and operator variation that a single timing would miss.
A reliable setup needs part or program identification, cycle start and completion timestamps, a clear setup-versus-run state, and good or reject counts, captured directly from the equipment as described in a NIST CNC data-collection example. These signals let the system calculate setup time, run time, and part counts without manual entry.
Cycle time is worth reviewing continuously once it is automated, since a live dashboard can flag drift the same shift it occurs rather than at the end of a week. Manual sampling, by contrast, is best used periodically as a spot check against the automated log rather than as the primary measurement method.
Yes, Mestric™ connects to equipment across multiple lines and logs cycle events from each, presenting the resulting KPIs on dashboards built for comparison between lines. Pricing and rollout scope are discussed during a demonstration, since they depend on the number of lines and machines involved.


 069 763 552