


TL;DR:
- Systematic maintenance practices can significantly reduce unplanned equipment downtime in manufacturing. Accurate tracking, quick repair response, preventive programs, and root cause analysis are essential to sustain long-term improvements.
Downtime reduction step by step is the systematic application of proven maintenance and operational practices to minimise unplanned equipment stoppages across a manufacturing facility. The industry term for this structured approach is unplanned downtime management, and it draws on methods including preventive maintenance (PM), Mean Time to Repair (MTTR) tracking, and condition monitoring. Plant managers who follow a structured workflow, rather than reacting to failures as they occur, consistently achieve measurable gains. The steps covered here move from immediate visibility actions through to long-term continuous improvement, giving you a complete framework to reduce equipment failures and protect production output.
The first step in any downtime reduction workflow is knowing exactly when and why your equipment stops. Without accurate records, every improvement effort is guesswork. You need to log every downtime event with a precise start time, end time, and a coded reason category such as mechanical failure, operator error, or material shortage.
Many facilities begin with a shared spreadsheet. That is a reasonable starting point, but manual downtime logging produces inaccurate and delayed data that masks the true detection and waiting intervals hidden inside each breakdown. The result is that you fix the wrong problems. Automated detection, where machine state changes are timestamped directly from the PLC or sensor, separates detection time, waiting time, and active repair time into distinct, measurable segments.
Communication delays and manual data gathering cause an average loss of 45 minutes per breakdown. That figure alone justifies moving to digital incident reporting. When an operator reports a fault through a structured digital form on a smartphone, with pre-built symptom lists, notification reaches the right technician in seconds rather than minutes. Platforms like HyperBUNKER demonstrate how automated issue escalation using sensors and PLCs can compress response times significantly in production environments.
| Method | Accuracy | Response speed | Data granularity | Cost to implement |
|---|---|---|---|---|
| Manual spreadsheet | Low | Slow (minutes to hours) | Reason code only | Minimal |
| Digital incident forms | Medium | Fast (seconds to minutes) | Reason + asset + operator | Low |
| Automated machine detection | High | Immediate | Detection, wait, repair split | Medium to high |
Profi tipp: Set up at least three downtime reason codes from day one: equipment fault, awaiting parts, and awaiting technician. These three categories alone reveal whether your bottleneck is a maintenance skill gap or a supply chain problem.
Shorter repair time is the fastest route to lower MTTR. The single most effective action is stocking the right spare parts. Stocking critical spare parts reduces MTTR by 15–25% by eliminating the wait time that follows a fault diagnosis. To identify which parts to stock, audit your last 12–24 months of failure records and list the components that appear most frequently.
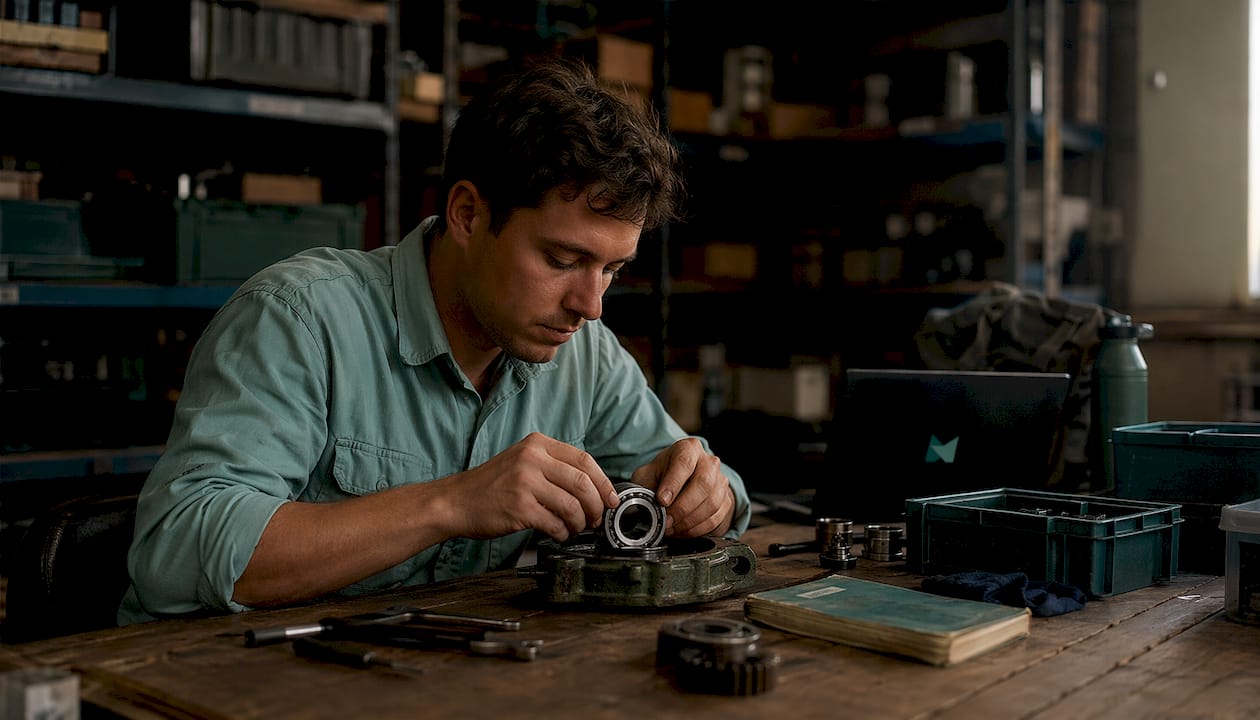
Alongside parts availability, technicians need context before they arrive at the machine. Maintenance teams lose 15–20 minutes per repair when they lack prior asset history. Digital breakdown reports that include recent repair logs, fault codes, and parts fitted allow a technician to arrive prepared rather than starting from scratch. This is where a digital maintenance system pays back quickly.
Standard operating procedures for your top five most common failures also cut repair time. Write a one-page fault diagnosis guide for each failure type and store it where technicians can access it on a mobile device at the machine. Operator training on autonomous maintenance basics reduces breakdowns by a further 5–10% by catching early warning signs before they become full stoppages.
Autonomous maintenance tasks for operators include:
Profi tipp: Laminate a one-page fault card for each critical machine and fix it to the control panel. Technicians find the right diagnostic steps in under 30 seconds, which removes the most common cause of wasted time at the start of a repair.
Preventive maintenance is the structured scheduling of inspection and servicing tasks based on manufacturer guidance and your own failure history. Preventive maintenance programmes on critical assets reduce breakdowns by 25–40% when PM compliance exceeds 90%. That compliance figure is the key metric to track. A PM schedule that exists on paper but is completed only 60% of the time delivers a fraction of its potential benefit.
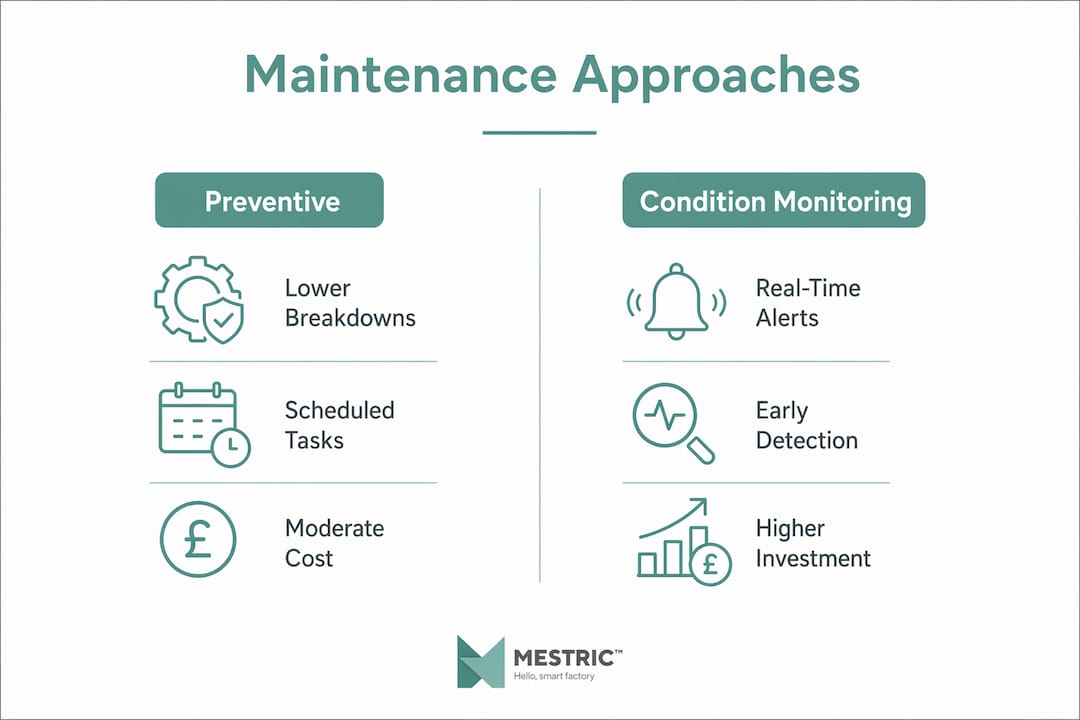
Condition monitoring takes prevention a step further by using sensors to detect early signs of failure in real time. Condition monitoring on highest-criticality assets reduces unplanned failures by 40–60%. Most unplanned downtime events show early warning signs that condition monitoring can detect, making prediction and prevention genuinely feasible rather than aspirational. The three most practical sensor types for manufacturing are vibration analysis, thermal imaging, and oil analysis.
| Approach | Breakdown reduction | Time to benefit | Investment level |
|---|---|---|---|
| Preventive maintenance (PM) | 25–40% | 3–6 months | Low to medium |
| Vibration monitoring | 40–60% | 6–12 months | Medium |
| Thermal imaging | 40–60% | 6–12 months | Medium |
| Oil analysis | 40–60% | 6–12 months | Medium to high |
Energy and utilities operators applying condition monitoring in industrial environments report similar failure reduction rates, confirming that the method transfers directly to manufacturing assets.
Profi tipp: Start condition monitoring on your single highest-criticality asset, the one whose failure causes the longest production stop. Prove the value there before rolling out to the wider asset base. This builds internal confidence and keeps the initial investment manageable.
Root cause analysis (RCA) is the structured investigation of why a failure occurred, not just what failed. Without RCA, the same faults recur. Structured RCA for major downtime events delivers sustained annual downtime improvements of 3–5%. That figure compounds year on year, making RCA one of the highest-return activities in a maintenance programme.
The two most practical RCA tools for plant teams are the 5 Whys and the fishbone diagram. The 5 Whys method asks “why did this happen?” five times in sequence until the root cause is reached, rather than stopping at the immediate symptom. The fishbone diagram maps potential causes across categories such as machine, method, material, and operator, which is particularly useful for complex failures with multiple contributing factors.
A searchable maintenance knowledge base accelerates this process. When technicians can retrieve the repair history of a specific asset in under a minute, diagnostic time falls by 15–25%. Every completed repair should generate a brief record: what failed, what was found, what was replaced, and what the suspected root cause was. Over time, this library becomes one of your most valuable operational assets.
Common RCA mistakes that undermine the process include:
Profi tipp: Schedule a 15-minute RCA review at the end of every week for any downtime event that exceeded two hours. Short, regular reviews build the habit without creating a bureaucratic burden.
Effective downtime reduction requires a layered approach: start with accurate tracking, shorten repair times, implement preventive maintenance, and sustain gains through root cause analysis.
| Pont | Részletek |
|---|---|
| Track every downtime event | Log start time, end time, and reason code to identify where time is actually lost. |
| Stock critical spare parts | Auditing failure history and pre-stocking parts reduces MTTR by 15–25%. |
| Achieve PM compliance above 90% | Preventive maintenance at high compliance rates cuts breakdowns by 25–40%. |
| Apply condition monitoring | Sensors on critical assets reduce unplanned failures by 40–60% over 6–12 months. |
| Use RCA consistently | Structured root cause analysis delivers 3–5% annual downtime reduction, compounding each year. |
The most common reason downtime reduction programmes stall is not a lack of tools. It is a lack of data transparency at the team level. When operators and technicians can see the downtime figures for their own shift, behaviour changes without any instruction from management. People naturally want to improve numbers they can see and own.
I have also seen plant managers make the mistake of chasing quick wins exclusively. Stocking spare parts and writing fault cards deliver fast results, and you should do both. But if you do not invest in condition monitoring and RCA within the first year, you will find yourself repeating the same quick wins indefinitely rather than building a genuinely lower baseline. The lépésről lépésre történő termelésoptimalizálás mindset means accepting that some of the best returns take six to twelve months to materialise.
Operator engagement is the factor most articles underestimate. Autonomous maintenance tasks only work when operators understand why they are doing them, not just what to do. A 30-minute session explaining how lubrication prevents bearing failure is worth more than a laminated checklist alone. Change management is not a soft skill in this context. It is a maintenance strategy.
— Andraž
Mestric connects directly with your manufacturing equipment to give you real-time production monitoring and automated downtime detection from the moment a machine stops. The platform captures machine state data continuously, so your team sees detection time, waiting time, and repair time as separate, measurable figures rather than a single opaque downtime total.

Mestric also automates the breakdown-to-work-order process, assigning tasks to the right technician with full asset history attached. That means technicians arrive at the machine prepared, not guessing. For plant managers building a production efficiency programme in 2026, Mestric provides the data infrastructure that makes every step in this guide measurable and repeatable. Request an onsite demonstration to see how connected machinery changes the numbers on your floor.
The first step is accurate downtime tracking. Log every event with a start time, end time, and reason code before attempting any other improvement.
Preventive maintenance programmes with compliance above 90% reduce breakdowns by 25–40% on critical assets.
MTTR stands for Mean Time to Repair. It measures the average time taken to restore a failed asset, and reducing it directly lowers the total production time lost to each breakdown.
Condition monitoring typically delivers measurable failure reduction within 6–12 months of installation on high-criticality assets, with unplanned failures falling by 40–60%.
The 5 Whys method is the most practical starting point. It requires no specialist training and consistently identifies root causes that symptom-level fixes miss.


 069 763 552