


TL;DR:
- Cost analysis for factories involves identifying, assessing, and assigning all manufacturing expenses to determine true unit costs and find savings. Implementing real-time, activity-based costing systems and focusing on yield loss and capacity utilization can significantly boost profit margins and cost accuracy. Success depends on product-level clarity, change management, and starting with a focused, manageable scope to demonstrate value quickly.
Cost analysis for factories is the systematic process of identifying, allocating, and evaluating all direct and indirect manufacturing costs to determine true unit costs and uncover savings opportunities. Known formally as manufacturing cost analysis, this discipline sits at the heart of every sound pricing and margin decision. Product-level cost visibility identifies margin compression before it becomes a crisis. This guide walks factory managers and financial analysts through the key cost components, modern costing tools, step-by-step implementation, and the most common pitfalls to avoid in any cost analysis guide for factories.
Direct materials represent 30–70% of total unit cost in most manufacturing operations. That single figure explains why material procurement, waste control, and supplier pricing dominate every serious industrial cost breakdown. Direct labour typically adds a further 15–30% in labour-intensive processes, making it the second largest variable to track.
Beyond those two headline figures, factory expense tracking must capture four additional cost categories:
Fixed costs deserve particular attention. Depreciation on capital equipment, lease payments, and fixed headcount do not shrink when output falls. That leverage cuts both ways: high utilisation spreads fixed costs across more units, lowering unit cost; low utilisation does the opposite.
Yield loss is the most underestimated cost driver in any factory financial assessment. A 30% yield loss creates a 43% cost premium on the finished unit because fixed costs are spread over fewer saleable goods. A factory producing 1,000 units with a 30% reject rate effectively pays the overhead of 1,000 units to sell only 700.

Pro Tip: Track yield loss by product line and shift, not just by month. Granular data reveals whether the problem sits in a specific machine, operator, or material batch, which makes corrective action far faster.
| Cost Category | Examples | Behaviour with Volume |
|---|---|---|
| Direct materials | Steel, resin, packaging | Fully variable |
| Direct labour | Assembly, machining | Variable to semi-variable |
| Manufacturing overhead | Depreciation, rent | Fixed |
| Semi-variable costs | Maintenance, quality testing | Rises with volume, not linearly |
| Yield losses | Scrap, rework | Variable, but fixed-cost amplified |
Traditional month-end variance reports are the single biggest structural weakness in factory cost management. An 8% material price rise reported 10 days later means a factory can produce 10,000 units at a loss before anyone acts. By the time the report lands on a manager’s desk, the damage is done.
Real-time, event-driven costing systems solve this by compressing the gap between cost event and management response. Real-time costing compresses response delays from days to minutes, enabling a 4–10% profit margin improvement. That is not a marginal gain. For a factory turning over £10 million, a 4% margin improvement adds £400,000 to the bottom line.
SaaS-based costing platforms offer a further structural advantage over legacy on-premise systems:
“Minimising time-to-visibility of cost-impacting events is more valuable than relying on delayed monthly variance reports.” — Dassault Systèmes DELMIA
Pro Tip: When rolling out a real-time costing system, train your team to define a response protocol for cost deviations above a set threshold. The technology only delivers value if people act on the alerts it generates.
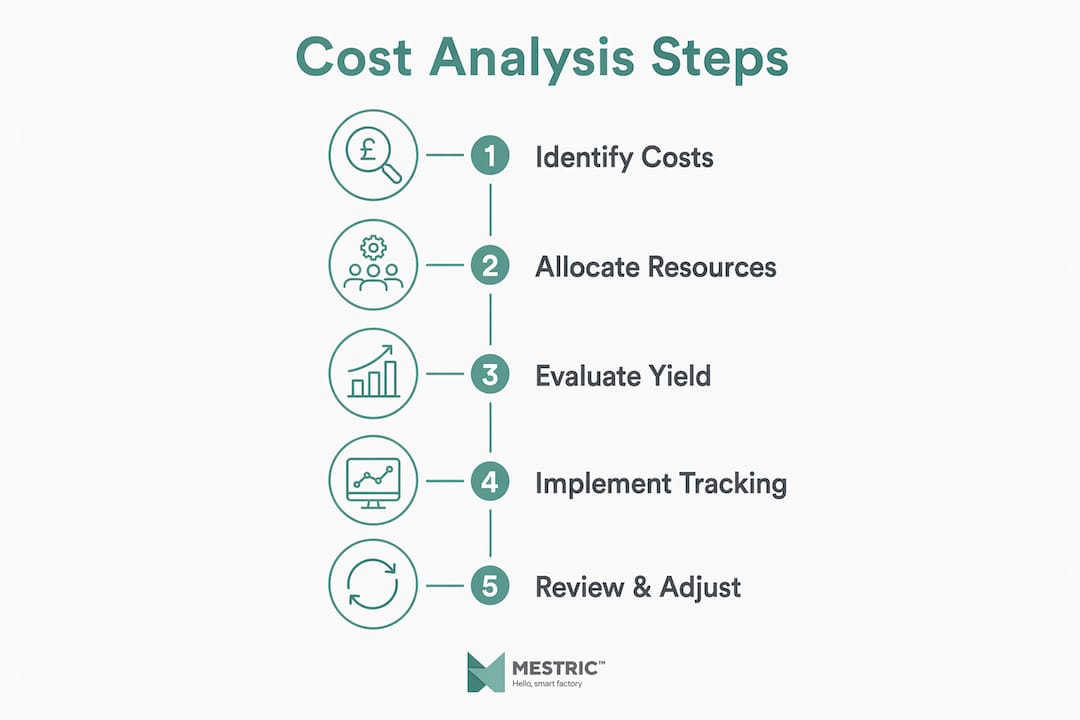
A structured approach to cost analysis for production removes guesswork and builds a repeatable financial assessment process. Follow these six steps:
Pro Tip: Start your cost analysis with your top five products by revenue. Getting accurate unit costs for those five will reveal more about your margin profile than a broad but shallow analysis across your entire catalogue.
The choice of costing methodology has a direct impact on reported unit cost and pricing decisions. The table below compares the three main approaches:
| Methodology | Best For | Advantage | Limitation |
|---|---|---|---|
| Job costing | Bespoke, low-volume production | Precise per-job cost visibility | High administrative effort |
| Process costing | High-volume, continuous lines | Low overhead, easy to apply | Less granular product insight |
| Activity-based costing | Complex, multi-product facilities | Accurate overhead attribution | Requires detailed process data |
Process-based cost estimation is a method that models individual manufacturing operations, including cycle times, machine rates, tooling costs, and material usage, to build a transparent and auditable cost model. It differs from historical or statistical approaches, which rely on past spend data and produce less traceable results.
Process-based estimation produces transparency traceable to machine rate, cycle time, material cost, and yield assumptions. That traceability is what makes it powerful in supplier negotiations. When you can show a supplier exactly which cost element drives their quoted price, you negotiate from a position of knowledge rather than assumption.
A common misconception is that process-based estimation requires a finished 3D CAD model. Accurate cost estimation does not require a finished CAD model; process-based tools generate estimates from design parameters alone. This means cost analysis can begin at the concept stage, influencing design decisions before tooling is committed.
Should-cost analysis is the specific application of process-based estimation for benchmarking supplier pricing. You build an independent cost model for a component, then compare it against supplier quotes. Gaps between your model and the quote open a structured conversation about where costs can be reduced, whether through design changes, material substitution, or process improvement.
Pro Tip: Use should-cost analysis before entering any supplier negotiation for components above £5,000 annual spend. The preparation time is modest, and the savings potential is significant.
Factory underutilisation is the most damaging and least discussed cost problem in manufacturing. Factories running at 50% capacity often experience negative profit because fixed costs do not scale down with volume. A plant designed for 500 units per day carries the same depreciation, lease, and fixed headcount whether it produces 500 units or 250. Every unit below full capacity increases the fixed cost burden per unit sold.
Delayed reporting compounds the problem. When cost data arrives weeks after the fact, managers cannot distinguish between a temporary variance and a structural cost shift. The result is reactive decision-making rather than proactive control.
The most effective cost reduction strategies address both problems simultaneously by moving to real-time monitoring and setting clear KPIs for cost-driving events. Useful KPIs for factory cost control include:
Indirect cost reduction is another area where managers often leave savings on the table. Energy consumption, maintenance scheduling, and consumable usage rarely receive the same scrutiny as direct materials. A structured resource utilisation review using digital tools can identify 5–15% reductions in indirect spend without touching direct production costs.
Pro Tip: Set a monthly review of your overhead absorption rate. If actual overhead consistently exceeds absorbed overhead, your allocation rates are out of date and your product costs are understated.
Effective factory cost management requires product-level visibility, real-time data, and a costing methodology matched to your production type.
| Point | Details |
|---|---|
| Direct materials dominate unit cost | Materials represent 30–70% of unit cost, making procurement and yield control the highest-leverage areas. |
| Yield loss amplifies fixed costs | A 30% yield loss creates a 43% cost premium, so tracking yield by line and shift is non-negotiable. |
| Real-time costing outperforms monthly reports | Compressing response time from days to minutes enables a 4–10% margin improvement. |
| Methodology choice shapes reported cost | Activity-based costing gives the most accurate overhead attribution in multi-product facilities. |
| Underutilisation destroys margins silently | Factories at 50% capacity often run at a loss due to fixed cost leverage. |
After working with manufacturing teams across a range of production environments, the pattern I see most often is not a lack of data. It is a lack of product-level clarity. Most factories can tell you their total monthly spend. Very few can tell you the true unit cost of their third-best-selling SKU, including yield losses and overhead absorption.
The second problem is change management, not technology. Real-time costing systems are available, affordable, and proven. The barrier is getting production supervisors, finance teams, and procurement to agree on a single source of truth. That alignment conversation is harder than the software implementation.
My honest view is that you should start with a narrow scope. Pick three to five products, build accurate cost models for those, and use the results to demonstrate the value of the approach. A quick win on a high-volume product builds the internal credibility needed to expand the programme.
Balancing accuracy with usability matters too. Activity-based costing is the most precise methodology, but it is also the most demanding to maintain. For many factories, a well-maintained process costing model with regular yield and overhead updates delivers 90% of the value at 30% of the effort. The goal is a costing system that people actually use, not a theoretically perfect model that sits untouched.
— Andraž
Mestric connects directly with your manufacturing equipment to deliver live KPIs including cost per unit, yield rates, machine occupancy, and downtime, all in one place. If your current reporting relies on end-of-month spreadsheets, the gap between a cost event and your awareness of it is costing you money.

Mestric’s Manufacturing Execution System gives you the real-time visibility that traditional reporting cannot match. Explore how MES compares to traditional manufacturing methods and what that means for your cost control. You can also review Mestric’s production optimisation guide to see how live cost data integrates with scheduling and throughput decisions. Book an onsite demonstration to see connected machinery in action within your own production environment.
Manufacturing cost analysis is the systematic identification, allocation, and evaluation of all direct and indirect costs in a factory to determine true unit costs. It covers direct materials, direct labour, overhead, and yield losses.
A 30% yield loss creates a 43% cost premium on the finished unit because fixed costs are spread over fewer saleable goods. Tracking yield by product line and shift is the most direct way to control this cost driver.
Job costing assigns costs to individual production orders and suits bespoke or low-volume manufacturing. Process costing averages costs across a continuous production run and is better suited to high-volume, standardised products.
No. Process-based cost estimation tools generate accurate estimates from design parameters alone, without a finished 3D CAD model. This allows cost analysis to begin at the concept stage and inform design decisions early.
Real-time costing compresses the delay between a cost event and management response from days to minutes. That speed enables a 4–10% profit margin improvement by allowing corrective action before significant losses accumulate.


 069 763 552