

Real-time downtime management means that your team sees a stoppage the moment it starts, knows which machine and which cause are involved, and follows a set response while the line is still idle. It replaces the old routine of reconstructing the event from paper logs at the end of the shift. This guide explains how it works on the shop floor, which data you need, what to do in the first minutes of a stoppage and how to turn each event into a fix that lasts.
Most plants already record downtime in some form. The difference is when the information arrives and how reliable it is.
In the reactive model, a machine stops, an operator deals with it, and someone writes a reason on a form. Later, a supervisor types the figures into a spreadsheet. By the time anyone reviews it, the details are guessed, the durations are rounded and the cause is often “other”. You learn that you lost time, but not why, and not while you could still act.
In the real-time model, four things happen together:
The first step removes the biggest weakness of manual logging: short stoppages. Micro-stops of a minute or two rarely get written down, yet across a shift on a fast line they can add up to more lost output than one long breakdown. Automated capture makes them visible. If you want the formal definitions of the loss categories, our article on Definition von Produktionsausfallzeiten sets them out.
You cannot manage what you cannot name. Most stoppages fall into a handful of families, and your reason list should reflect them:
The point of grouping them is practical. Each family has a different owner and a different remedy, so the alert should go to the person who can act on that family. A material shortage routed to a maintenance technician wastes everyone’s time.
Detection has two layers: noticing that a machine has stopped, and understanding whether the stopped machine is the real problem.
The second layer is where many plants go wrong. In a flow line, the machine that stops first is not always the constraint. Research on shop-floor bottleneck detection explains that starved processes point upstream, while blocked processes point downstream. A station waiting for parts indicates a problem earlier in the flow. A station that cannot pass parts on indicates a problem later in the flow. The same study describes the manual “bottleneck walk”, in which someone walks the line and observes these states.
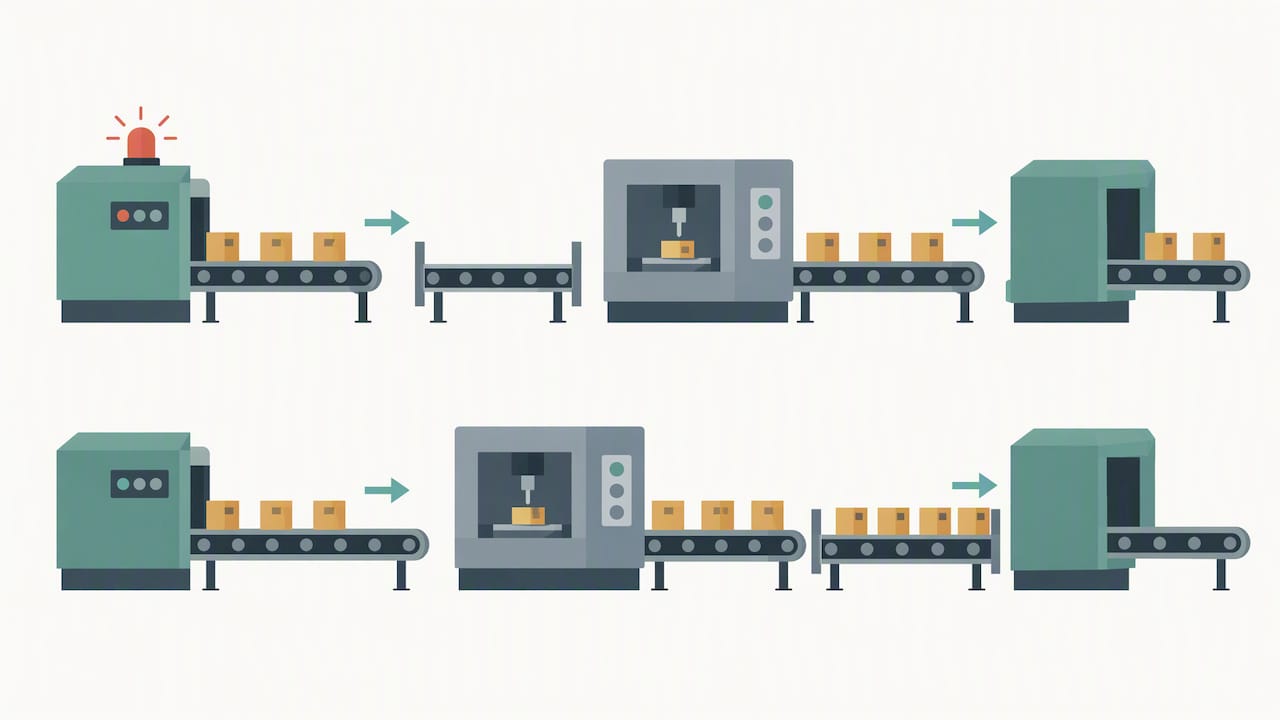
You can use the same logic with live data. If your system records for every machine whether it is running, starved, blocked or faulted, you can see the chain of states on one screen and trace it to the station that is causing the others to wait. That saves the walk, and it works at three in the morning when nobody is walking anywhere.
In practice, set your detection rules like this:
A live view of these states is the core of production monitoring. We describe the building blocks in our guide to real-time production monitoring systems.
Software raises the alarm. People restore production. A clear sequence stops the response from depending on who is on shift.
This follows the logic of the help chain that the Lean Enterprise Institute describes from NUMMI: stoppage management as a designed escalation process, in which abnormalities are made visible, help arrives quickly, the standard is restored, and deeper problem-solving happens elsewhere so the line does not depend on individual heroics.
Speed never justifies an unsafe intervention. In Slovenia, GOV.SI guidance on the safety of machinery states that machinery must be designed and supplied so that adjustment, maintenance and use can be carried out safely. It applies the principle of eliminating or minimising risk first, then adding protective measures and information about residual risks. Your stoppage procedure should reflect this: the fastest restart is the one that follows your machine manufacturer’s instructions and your site’s safety rules. Questions about a particular machine belong with your safety officer and the equipment supplier.
Dashboards invite you to track everything. A smaller set, used well, drives better decisions.
| Metrik | What it tells you | Typical decision |
|---|---|---|
| Total unplanned downtime per line and shift | How much capacity you lose | Where to focus improvement effort |
| Number of stoppages | Whether the loss comes from many short events or a few long ones | Micro-stop reduction or breakdown prevention |
| Stoppage duration by cause (Pareto chart) | Which causes cost the most time | Which cause to attack first |
| Time to respond | How long a stoppage waits before someone acts | Staffing, escalation rules, alert routing |
| Machine occupancy | Share of available time the machine is producing | Scheduling and capacity planning |
| Downtime cost per hour | The financial weight of each cause | Business case for a fix |
Two cautions. First, averages can mislead. A report on incident metrics from Google’s site reliability engineers notes that MTTR and similar statistics are poorly suited to decision-making and trend analysis, and that metrics should be tested for robust insight and tailored to the question you are asking. The report concerns software incidents, but the statistical point carries over to factory repair times, which are typically a few quick fixes and a few very long ones. Look at the distribution, not only the mean.
Second, put money on the minutes. A stoppage that costs a known amount per hour gets attention and budget. Our guide on how to calculate a defensible hourly downtime cost walks through the inputs.
The real return on real-time data comes after the line restarts. Each record carries a cause, a duration and a context. Together they show patterns that nobody could see from memory.
Research from Chalmers University in Sweden argues that effective root-cause analysis has to move away from unstructured, expert-dependent work towards data-driven solutions that integrate different data sources, support collaboration and promote employee learning. That is a practical description of what a weekly downtime review should be:
The last step is often skipped. Without it, you have a list of good intentions and no evidence that anything improved.
For persistent causes, a useful structure is to ask “why” until you reach something you can change: a procedure, a setting, a part specification or a training gap. The answer should be recorded in the same system as the stoppage so the next person to see the same fault finds the history.
Some stoppages can be avoided entirely. The EU-funded Z-BRE4K project points out that traditional preventive maintenance is often insufficient for dynamic processes, and calls for predictive strategies that forecast failures at component and system level. If your stoppage data shows the same component failing repeatedly, you have a candidate for condition-based or predictive maintenance. Detailed advice on maintaining packaging machines shows how component-level upkeep planning looks for one type of equipment.
We describe a structured way to test this approach on your own equipment in our 6 to 12 week predictive maintenance pilot.
Not every stoppage is a fault. Slow setups, long dispersion or milling steps and other process waits also hold lines. Practical examples of tactics for reducing milling time show how one process step can be shortened with tested changes, and the same approach of measuring the step before and after applies to any changeover you are trying to compress.
The case for connecting machines is not only theoretical.
The pattern across these examples is consistent: technology alone does not remove stoppages. Technology combined with agreed procedures and trained people does.
When we talk to production managers, the first complaint is rarely about the machines. It is about not knowing. The line stopped, but nobody can say exactly when, for how long or why. Everything else follows from that gap.
We design Mestric around closing it. The platform connects directly to equipment, collects stoppage data automatically and shows it on live KPI dashboards, so that the first conversation of the shift is about causes and actions rather than about whose figures are right. We think the most valuable change is cultural: a short, trusted reason list, a response that does not depend on one experienced supervisor, and a review habit that closes the loop. Software supports this. It cannot replace it.
We also advise starting small. Choose one line, agree the reason list with the operators who will use it, and run the weekly review for a month. The pattern that appears is usually clear enough to justify the next step.
— Andraž
If you are choosing a system, test it against these questions:
For a wider view of how MES compares with the other tools on a plant’s software map, see 7 types of manufacturing software every plant manager should know, and our comparison of MES and traditional manufacturing methods. If you are weighing the practical gains, seven proven benefits of real-time monitoring is a good next read.
Mestric™ MES connects to your machines, tracks performance, downtime, quality parameters and cost in real time, and adds AI-powered recommendations for process optimisation. We offer a demonstration through an onsite presentation, where you can see connected machinery working in a real production environment. Pricing is not published, so the demonstration is the place to discuss your lines, your reason list and what a first step could look like. You can start from our home page.
If you want to begin this month, here is a sequence that fits most plants:
For a longer treatment, our 2026 guide to reducing production downtime and the factory performance tracking workflow cover the surrounding practice in more detail.
Normal reporting records the stoppage after the event, usually by hand and often from memory. Real-time management detects it automatically from machine signals, alerts the right person while the line is idle and captures the cause immediately. You get exact durations, including short stoppages that manual logs miss.
A spreadsheet can work for one machine and a very disciplined team. It struggles when several lines, shifts and products are involved, because entries are late and incomplete. An MES connected to equipment removes the manual entry and gives you live views and history in one place.
Record every stop above the threshold you define, planned and unplanned, and keep the two categories separate. Short stoppages matter because they are frequent. Many plants begin with a one-minute threshold and adjust it once they see the data.
Live visibility is useful from the first shift, because stoppages become visible at once. Patterns in causes usually need a few weeks of consistent records before a weekly review can pick reliable priorities. The speed depends mostly on how well the reason list is agreed with operators.


 069 763 552