


Price an hour of production downtime as lost contribution margin, but only when the output cannot be recovered later, plus incremental recovery costs such as overtime, expedited parts and restart scrap. Your first two actions are to measure good units per hour at your bottleneck asset and to run a recoverability test against your order book. That single number then tells you which spares, sensors or maintenance projects deserve funding first.
Kurzfassung:
- Recovery costs can be significantly reduced if units can be made up later, with the lost contribution margin only applying when output cannot be recovered.
- The typical outage cost is around $125,000 per hour in many plants, but smaller manufacturers often see lower figures, and the actual recoverable value depends on data connectivity and asset criticality.
- Parts search time and lead-time delays are the main hidden drivers of downtime length, making spare parts management crucial before investing in new sensors or hardware.
- Predictive maintenance offers the highest potential savings, contributing an estimated $17 million in recoverable value per facility annually once basic data systems are in place.
- Measuring downtime accurately with real-time MES systems and reconciling manual and automated data is essential for prioritizing improvements and justifying investments.
A downtime figure is only useful when it separates what you genuinely lose from what you were going to spend anyway. Lost contribution margin, the revenue from unmade units minus their variable cost, only applies when that output cannot be made up later. Incremental recovery costs sit on top: overtime to catch up, expedited freight for a replacement part, scrap generated during restart and any contractual penalties for late delivery.
Fixed costs and wages you were already committed to paying do not belong in the calculation. Including them double counts money you would have spent regardless of whether the line ran.
Published benchmarks help you sanity-check your own number, though they rarely transfer directly to your plant.
Verdantis estimates that roughly $17 million of that recoverable value per facility per year comes specifically from predictive maintenance, signaling where the biggest lever tends to sit once basic data connectivity is in place. Treat every published range as a ceiling check, not a substitute for your own plant-level arithmetic.
The calculation method described by ManufacturingMag is straightforward once you have the right inputs gathered in one place. Collect these before you start:
The formula is: cost per hour = (lost good units per hour × contribution margin per unit, only if unrecoverable) + incremental recovery costs.
Take a line that produces 500 units an hour, sells each for £40 with a variable cost of £25, giving a contribution margin of £15 per unit. If the order is sold out and cannot be delayed, the lost-margin component alone is 500 × £15, or £7,500 an hour. Add recovery costs: say four hours of overtime at a £20 premium per worker across six operators (£480), an expedited part costing £600 more than standard freight, and restart scrap of 30 units at £25 variable cost (£750). Total recovery cost is £1,830, giving a defensible figure of £9,330 for that hour.
If the same stoppage happens when the line is running below capacity and the lost units can be made up on a later shift, the lost-margin component drops to zero. Your cost for that hour becomes the £1,830 in recovery costs alone, a difference that matters enormously when you are deciding whether a spare part is worth stocking.

To avoid double counting, never add lost margin and full recovery cost together when the order is only partially affected, and never include depreciation or rent, which continue regardless of the stoppage. When you present this to finance, show both the formula and the inputs behind it rather than a single figure, since the assumptions are what get questioned first. Our guide to defining production downtime covers the underlying metrics if you need to standardise definitions across shifts first.
The same stoppage can cost £9,330 or £1,830 depending on one question: can you make up the lost units later? This recoverability test is what separates a genuine capex case from an inflated one, and it deserves its own check before you finalise any number.
There are three realistic outcomes. Output can be permanently lost, typically when the line already runs near capacity and a customer order slips. It can be fully deferred, when spare capacity, weekend shifts or inventory buffers absorb the gap without any lost sale. Or it can be partially recoverable, the most common case, where some units are made up and some sales are missed or delayed with a penalty attached.
Work through these checks before assigning a cost:
For budgeting and insurance conversations, build two versions of the figure: a conservative case assuming partial recoverability and higher recovery costs, and an upside case assuming full lost-margin exposure during peak demand. Presenting both gives finance a realistic range rather than a single number that invites debate.
The obvious costs of a stoppage, lost output and overtime, are usually smaller than the hidden ones that build up around the edges of an incident. Mapping these buckets properly is what turns a rough estimate into something you can defend line by line.
Parts unavailability is commonly identified as the largest single driver of outage length in Siemens and Verdantis analyses, which is why spare-parts location and lead-time data deserve attention before you invest in anything more elaborate. Long lead times on critical components compound this problem: guidance on shortening additive lead times is a useful reference for procurement teams trying to reduce the wait on replacement parts.
Record each of these costs at the time of the incident, not afterwards from memory. A simple incident log with five fields, cause, duration, recovery cost category, amount and whether the output was recoverable, gives you the raw material for every calculation above.
You cannot price what you do not measure consistently, and most plants already have more of the raw data than they realise scattered across PLC logs, CMMS records and paper sheets. The job is reconciling those sources into one number per stoppage.
Four metrics matter most: downtime minutes by cause, mean time to repair, mean time between failures, and overall equipment effectiveness, which combines availability, performance and quality into a single score. Alongside these, track lost good units at the constraint asset specifically, since that is the figure the cost formula actually needs.
A one-day exposure audit is enough to prioritise where to look first: identify the bottleneck asset, pull the last three months of downtime minutes by cause, estimate average restart scrap and average expedited-part premium, then run the per-hour formula against that asset alone. Our piece on analysing production downtime walks through this audit in more detail, and the root-cause checklist is built for closing out the first analysis in a single shift.
Pro-Tipp: Run the audit on your worst-performing asset first: a single week of clean data there usually reveals more than a month of averaged data across the whole line.
Once you have a defensible per-hour figure, the next question is where to spend to reduce it. The evidence points fairly consistently towards a small number of levers, in a specific order.
Predictive maintenance is identified as a leading contributor to the recoverable value per facility per year in the Verdantis analysis, making it the single largest lever once basic data connectivity exists. Industry commentary on unscheduled downtime from bodies such as the Institute for Supply Management similarly identifies predictive maintenance as a leading mitigation practice against recurring unplanned stops.
For a pilot, keep the scope tight: one bottleneck asset, three months of baseline downtime data, and a clear before-and-after comparison of MTTR and lost good units. Estimate ROI by multiplying the hours of downtime you expect to avoid by your own cost-per-hour figure, then compare that against the pilot’s cost. Our guide to reducing production downtime sets out the sequence in more detail, and a structured predictive maintenance pilot running six to twelve weeks is a practical way to test the case on one line before committing further.
Pro-Tipp: Size your first pilot to the asset with the highest cost-per-hour figure from your own calculation, not the asset that fails most often; frequency and cost rarely align.
A cost-per-hour figure only earns its keep once it changes what you fund. Multiply the hours you expect to save by that figure to rank competing projects on the same basis, whether that is a spare part, a sensor or a maintenance contract.
Spares decisions follow the same logic: weigh the carrying cost of stocking a part against the recovery cost avoided if it is on the shelf when needed, and use criticality scoring so the highest-cost assets get priority stock. When you present the case to finance, show a conservative figure based on partial recoverability alongside an upside figure based on full lost-margin exposure at peak demand. That range, built from your own data, tends to hold up far better under scrutiny than a single number borrowed from a vendor survey.
— Andraž
Working out one defensible number is useful, but the real value comes from tracking it continuously, and that is where a manufacturing execution system earns its place on the shop floor. Mestric™ MES connects directly to your equipment and captures good units, downtime minutes and OEE in real time, replacing the manual log reconciliation described earlier.
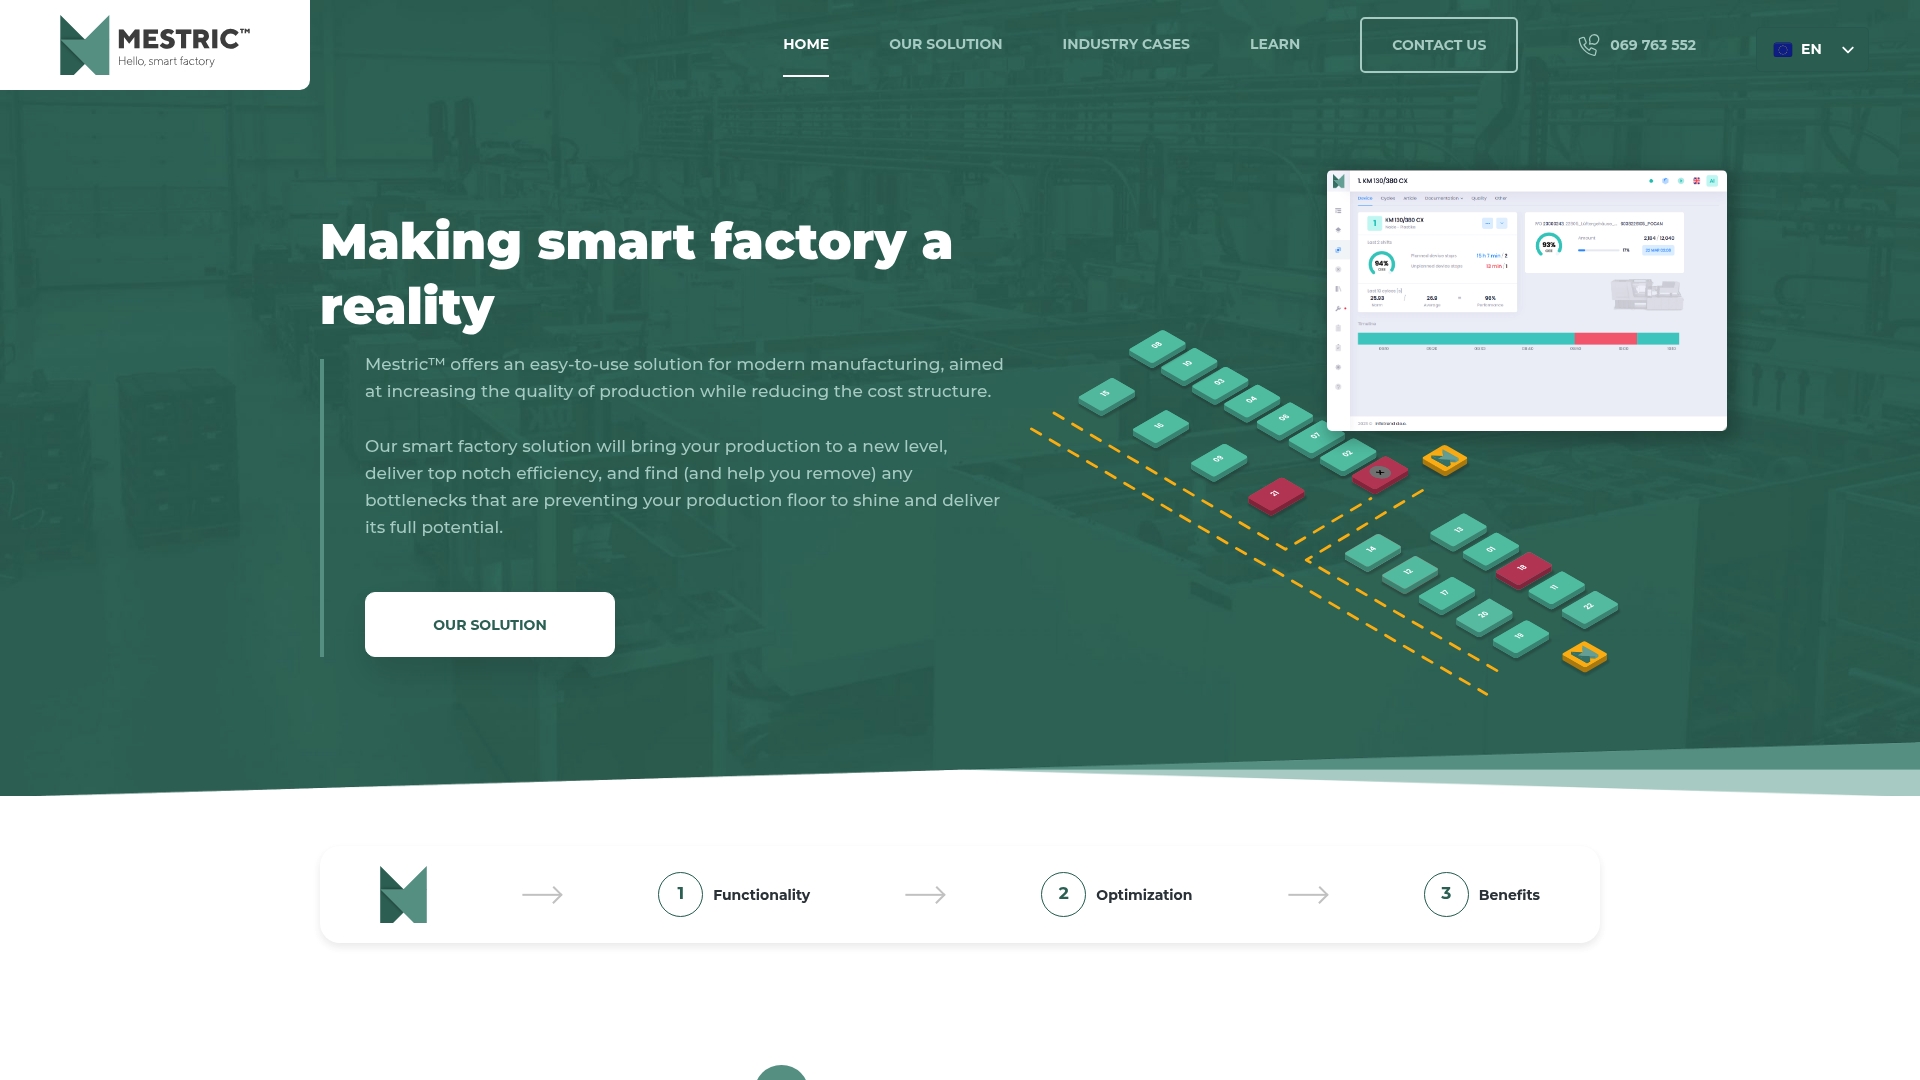
Because Mestric™ links asset data with your KPI dashboards, you can see which line is losing the most contribution margin as it happens, not three weeks later during a monthly review. The same connectivity that shortens the search for a spare part also feeds the data foundation a predictive-maintenance pilot needs. If you want to see this working against real equipment, visit the Mestric™ MES solution page or arrange a demonstration to walk through your own downtime figures with the platform live.
The Verdantis analysis and ManufacturingMag’s calculation method anchor the benchmarks and formula above. Gov covers public aid for damage to machinery, stock and income after natural disasters.
Cost per hour equals lost contribution margin, counted only when the output genuinely cannot be recovered later, plus incremental recovery costs such as overtime, expedited parts and restart scrap. This method, described by ManufacturingMag, keeps fixed costs out to avoid double counting.
Industry surveys reported by ABB put a typical outage at around $125,000 per hour across many industrial plants, though this varies enormously by sector and plant size. Automotive and other capital-intensive lines tend to sit far above this figure, while smaller discrete manufacturers usually sit well below it.
Business-interruption cover, where held, may respond to lost income following a covered event, and separate public support can apply to damage involving machinery, stock or income loss after events such as natural disasters. GOV.SI guidance sets out the relevant damage categories and coverage caps, and eligibility depends on the specific policy or scheme in place.
Time spent searching for the right spare part is commonly the largest single driver of how long an outage lasts, according to Verdantis and Siemens analyses. This makes spare-parts location and lead-time data one of the highest-value areas to fix before investing in anything more complex.
Connecting existing parts, asset and work-order data typically unlocks more recoverable value than buying new sensors, and predictive maintenance pilots on the highest-cost bottleneck tend to follow as the next step. Verdantis estimates predictive maintenance accounts for roughly $17 million of the recoverable value per facility per year once that data connectivity is in place.


 069 763 552