


Effective analysis of downtime causes combines three things: accurate failure data, the right investigation method for the problem at hand, and a corrective action that gets logged and verified, not just implemented and forgotten. Some digital platforms support this by capturing stoppage data in real time and tracking corrective actions through to closure. Your first move after any significant stoppage is simple: capture and log it before the line restarts, while the evidence is still fresh.
Kurzfassung:
- Automated downtime capture tools can record micro-stoppages under five minutes, providing a more complete data set for effective RCA analysis.
- Using the correct analysis method depends on failure complexity, with simple faults suited for 5 Whys and safety-critical issues requiring Fault Tree Analysis.
- Verifying root cause fixes through scheduled check-ins at 30, 60, and 90 days ensures the problem does not recur and improves key metrics like MTBF.
- Building a mandatory logging process before restarting equipment, along with assigning clear ownership, increases RCA discipline and accountability.
- Modern MES platforms enhance RCA workflows by automatically capturing evidence, linking corrective actions, and surfacing patterns that manual logs may miss.
Most plants don’t have a downtime problem. They have a recurring downtime problem, because the fix applied last time addressed a symptom rather than the cause. Reset a fault code, swap a part, restart the line: production moves again, but nothing has actually changed about why the failure happened. Three or four weeks later, the same machine stops for what looks like a different reason but is really the same unresolved cause wearing a new face.
Root causes tend to sit at one of three levels. A physical cause is the broken part or worn component. A human cause is the action or omission that triggered the failure, such as a missed lubrication step. A latent cause is the system failure behind that, often a maintenance schedule, a training gap, or a procurement decision that put the wrong part on the shelf. Fixing only the physical layer is why the same fault reappears.
Common mistakes compound the problem:
A Slovenian university thesis on gearbox housing production found that combining statistical process control with FMEA identified the actual root cause of a cylindricity defect, and that the corrective action restored process capability once implemented and checked, not before.
A repeatable workflow beats an inspired one. Follow the same five steps every time, and your team stops relying on whoever happens to be sharpest that day.
Pro-Tipp: Verification isn’t just “did it stop failing”. Confirm your proposed cause is necessary, sufficient, and controllable, meaning it genuinely explains the failure, could produce it alone, and can actually be managed going forward, as Caddis Systems’ downtime RCA methodology sets out.
Choosing the wrong method wastes time in both directions. A 5 Whys session on a complex, multi-factor chronic failure will produce a shallow, unconvincing answer. A full Fault Tree Analysis on a simple bearing failure wastes a day nobody had spare.
The escalation rule is straightforward: if a 5 Whys keeps looping back to “we don’t know” at the third or fourth why, stop and move to a fishbone session with wider input. If the fishbone surfaces several plausible root branches rather than one dominant cause, particularly for safety-critical equipment, that’s your signal to escalate to FTA. YAFEX’s manufacturing RCA guide sets out broadly this same decision logic for method selection and team composition.
Manual downtime logs miss more than most plant managers realise. Operators log the stoppages worth writing down: the ones that hold up production for minutes, not seconds. Automated capture through sensors or MES integration catches every micro-stoppage under five minutes, which usually erode OEE performance rather than availability, and often account for more lost capacity than the big, visible failures everyone remembers.
That gap matters because TeepTrak’s research on OEE downtime tracking shows automated tracking feeds Pareto analysis with a far more complete picture, which means corrective actions get directed at the categories actually costing the most output, not just the ones that generated a complaint.
Standardise the data fields you collect for every stoppage, whether captured automatically or manually:
Analytics tools built on this standardised data can surface patterns a single investigator would miss entirely, cross-asset correlations, recurring shift-pattern effects, or a fault code that clusters around a specific supplier batch. Research into causal Bayesian networks combined with knowledge graphs shows that hybrid approaches pairing expert judgement with data-driven causal models reduce false cause-effect links and speed up learning across complex manufacturing processes, a direction increasingly built into modern analytics platforms rather than left to manual pattern-spotting. Reviewing quality data alongside downtime logs also helps: our guide on Überwachung der Fertigungsqualität covers how defect patterns and stoppage patterns often share the same root cause.
An RCA that stops at “we found the cause” hasn’t finished. The corrective action needs the same rigour as the investigation itself.
A strong corrective action names a specific change, not a vague intention. “Replace the worn cam follower and add it to the weekly PM checklist” is verifiable; “improve maintenance” is not. It has a named owner, a due date, and a scheduled verification check, ideally the same 30/60/90-day cadence used to confirm the cause was right in the first place.
Three KPIs tell you whether your RCA programme is actually working:
OxMaint’s research on equipment failure RCA links disciplined, CMMS-tracked corrective actions to faster MTBF improvement. Once a fix is verified, roll it out to sister assets running the same process and update the preventive maintenance schedule accordingly, otherwise you’ve fixed one machine and left three others waiting for the same failure.
Running your first structured RCA doesn’t need a steering committee. It needs one stoppage, one team, and one shift.
Store at minimum: asset ID, failure code, duration, root cause description, corrective action, owner, and verification date.
The single biggest obstacle to good RCA has nothing to do with method selection. It’s the pressure to restart the line before anyone has actually captured what happened. A supervisor under output pressure will reset the fault and wave the operator back to work, and the investigation simply never gets a first draft.
The fix is structural, not motivational. Build a shift-gate rule: no restart authorisation without a logged problem statement. Trigger a mandatory CMMS entry the moment a stoppage crosses a duration threshold. Name an owner for every corrective action, not a department, because “maintenance will look into it” is where accountability goes to die.
Leaders who treat RCA as lost production time will always deprioritise it under pressure. Leaders who treat it as an investment against next month’s identical failure build the discipline that actually sticks, and our step-by-step guide to reducing downtime covers how to embed that logging habit into daily routine rather than treating it as an occasional exercise.
— Andraž
Everything above depends on capturing evidence fast and closing the loop reliably, which is precisely where most manual RCA processes quietly fail. Some MES platforms connect directly to shop-floor equipment, providing real-time performance tracking and automated downtime capture that catches the micro-stoppages a paper log would miss entirely.
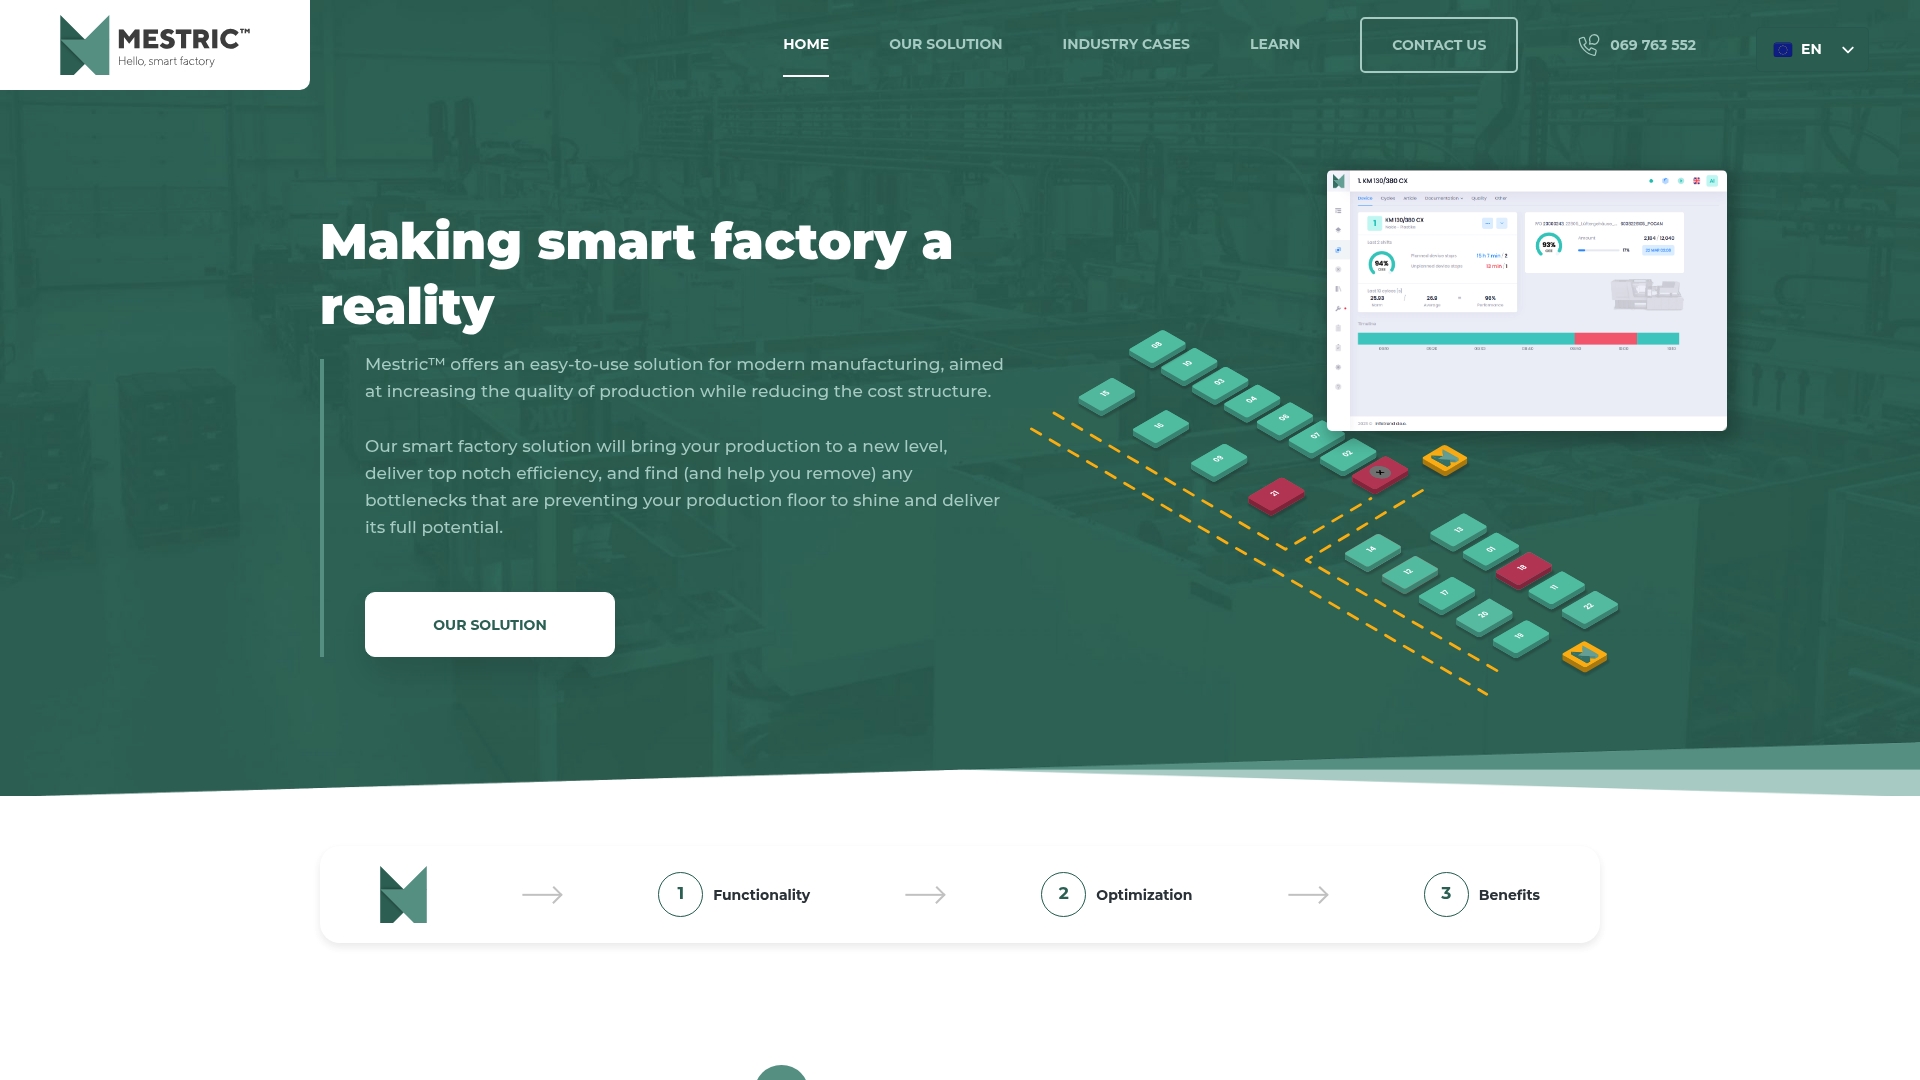
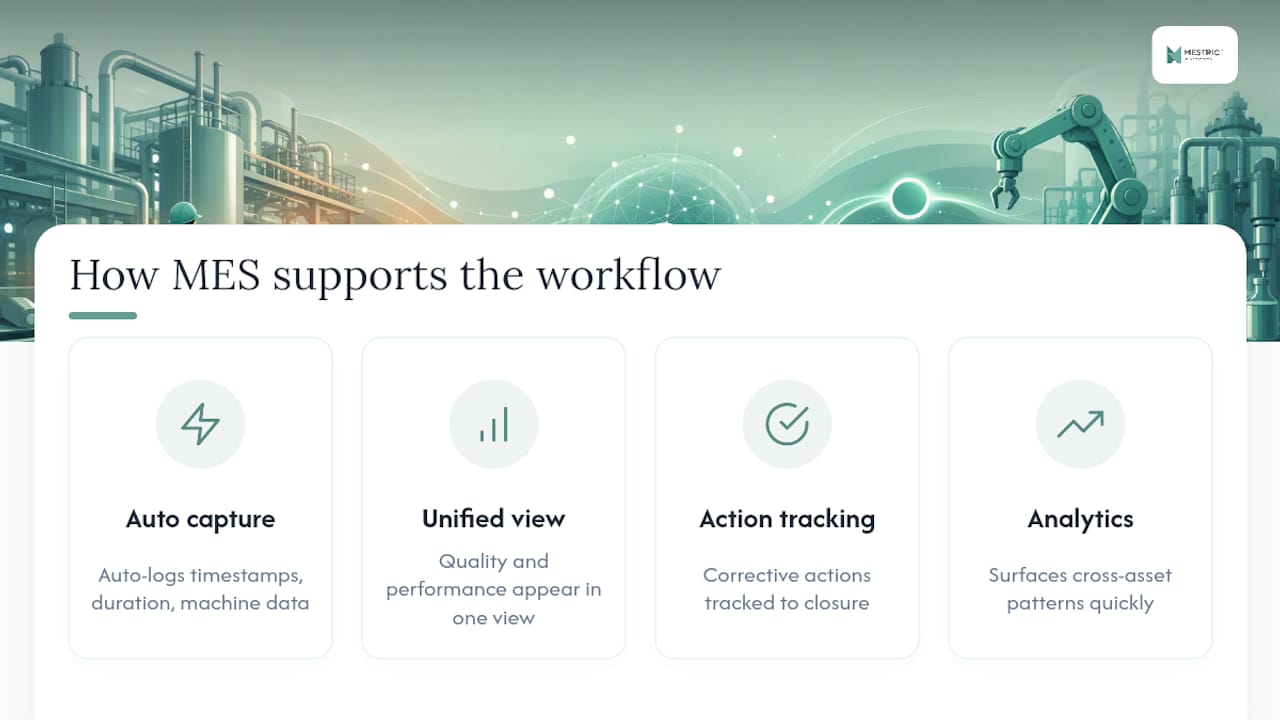
When a stoppage happens, some MES platforms log the timestamp, duration, and machine data automatically, giving teams the evidence base the problem statement needs without anyone reconstructing events from memory hours later. Quality monitoring can run alongside performance data, so defect patterns and downtime patterns show up in the same view rather than two disconnected systems. Corrective actions get tracked to closure rather than left in a notebook, and analytics tools help surface cross-asset patterns that might otherwise take weeks to spot manually.
If you want to see how this maps onto your own production line, some providers offer onsite demonstrations showing connected machinery in a real working environment. Explore how MES compares to traditional manufacturing tracking and book a demo to see automated RCA logging in action.
The workflow above draws on a mix of applied research and industry practice. Caddis Systems’ downtime RCA methodology provided the core structure for evidence collection and verification. OxMaint’s plant RCA guidance informed the CMMS linkage and recurrence-check cadence. TeepTrak’s OEE downtime research shaped the section on automated capture. The University of Ljubljana gearbox thesis offered a grounded, local example of FMEA applied to a real production defect, and arXiv’s causal Bayesian network research informed the outlook on analytics-assisted RCA.
It’s a structured investigation process that identifies why a machine or line stopped, using data collection, a chosen analysis method (5 Whys, fishbone, or FTA), and a verified corrective action logged in a CMMS or MES.
A straightforward 5 Whys session takes 15 to 30 minutes; a fishbone analysis for a chronic multi-factor issue runs 45 to 90 minutes; Fault Tree Analysis for complex or safety-critical failures can take several hours to a few days.
A symptom fix restores the machine to running condition, such as resetting a fault code, while a root cause fix addresses the physical, human, or latent cause behind the failure so it doesn’t recur.
Track mean time between failures (MTBF), repeat-failure rate within 90 days, and corrective action completion rate, all of which improve measurably once RCA findings are logged and verified rather than left informal.
Yes. Some platforms capture downtime automatically, link corrective actions to specific stoppage events, and use analytics to surface patterns across machines that a manual log would miss.


 069 763 552