


Kurzfassung:
- Die Kostenanalyse für Fabriken beinhaltet die Identifizierung, Bewertung und Zuordnung aller Herstellungskosten, um die tatsächlichen Stückkosten zu ermitteln und Einsparungen zu erzielen. Die Implementierung realzeitiger, aktivitätsbasierter Kostenrechnungssysteme sowie die Fokussierung auf Produktionsverluste und Kapazitätsauslastung können die Gewinnmargen und die Kostengenauigkeit erheblich steigern. Der Erfolg hängt von der Klarheit auf Produktebene, der Änderungsmanagement und dem Einsatz eines fokussierten und überschaubaren Rahmens ab, um schnell Mehrwert zu demonstrieren.
Die Kostenanalyse für Fabriken ist der systematische Prozess zur Identifizierung, Zuweisung und Bewertung aller direkten und indirekten Herstellungskosten, um die tatsächlichen Stückkosten zu ermitteln und Möglichkeiten zur Kosteneinsparung zu erkennen. Formal bekannt als Produktionskostenanalyse – diese Disziplin steht im Mittelpunkt jeder sinnvollen Preis- und Margenentscheidung. Kosteneffizienz auf Produktebene sichtbar machen Identifiziert Margenkompression, bevor sie zu einer Krise wird. Diese Anleitung führt Werksmanager und Finanzanalysten durch die wichtigsten Kostenkomponenten, moderne Kostenrechnungswerkzeuge, die Schritt-für-Schritt-Implementierung und die häufigsten Fallstricke, die bei jeder Kostenanalyse für Fabriken zu vermeiden sind.
Direkte Materialien stellen 30–70 Prozent der Gesamtkosten dar. Dies entspricht dem Gesamtbetriebskostenaufwand in den meisten Fertigungsabläufen. Diese einzige Zahl erklärt, warum Materialbeschaffung, Abfallmanagement und Preisgestaltung der Lieferanten bei jeder seriösen Analyse der industriellen Kosten eine große Rolle spielen. Die direkte Arbeitszeit erhöht in arbeitsintensiven Prozessen in der Regel die Kosten um weitere 15–30%, was sie zur zweitgrößten variablen Kostenposten macht, die man verfolgen muss.
Außer diesen beiden Kennzahlen müssen die Kosten der Fabrik überwacht werden und weitere vier Kostenkategorien erfasst werden:
Festgestellte Kosten verdienen besondere Aufmerksamkeit. Abschreibungen auf Investitionsgüter, Pachtzahlungen und die Festlegung der Mitarbeiterzahl verringern sich nicht, wenn die Produktion sinkt. Diese Synergieeffekte wirken sich sowohl positiv als auch negativ aus: Ein hoher Auslastungsgrad verteilt die Festgestellten Kosten auf mehr Einheiten und senkt die Stückkosten, ein niedriger Auslastungsgrad hat genau das Gegenteil.
Der Ertragseinbruch ist der am wenigsten unterschätzte Kostenfaktor in jeder finanziellen Bewertung einer Fabrik. Ein Ertragseinbruch von 30% führt zu einem Kostenplus von 43% für die fertige Einheit, da die Fixkosten über weniger verkäufbare Produkte verteilt werden. Eine Fabrik, die 1.000 Einheiten produziert und eine Ablehnungsrate von 30% hat, zahlt effektiv die Kosten für 1.000 Einheiten, um nur 700 zu verkaufen.

Pro-Tipp: Verfolgen Sie die Abnahme der Produktivität entlang der Produktlinien und Schichten, nicht nur im einzelnen Monat. Die detaillierten Daten zeigen, ob das Problem auf einer bestimmten Maschine, bei einem bestimmten Bediener oder bei einer bestimmten Materialmenge liegt – wodurch Maßnahmen zur Korrektur deutlich schneller durchgeführt werden können.
| Kostenkategorie | Beispiele | Verhalten mit Volume |
|---|---|---|
| Direkte Materialien | Stahl, Harz, Verpackung | Vollständig variabel |
| Direkte Arbeit | Montage, Bearbeitung | Variabel zu halbvariabel |
| Verwaltungsaufwand im Produktionsbereich | Abnutzung, Miete | Löschung |
| Halbvariable Kosten | Instandhaltung, Qualitätsprüfung | Steigt mit dem Volumen, nicht linear |
| Ausbeuteverluste | Abfall, Umarbeitung | Variabel, aber die Fixkosten wurden erhöht |
Traditionelle Monatsendabläufe sind die größte strukturelle Schwäche bei der Kostenverwaltung in Fabriken. Eine 8% Tage später wurde ein Anstieg der Materialpreise gemeldet Das bedeutet, dass eine Fabrik 10.000 Einheiten mit Verlust produzieren kann, bevor irgendjemand etwas tut. Bis der Bericht bei einem Manager ankommt, ist der Schaden bereits angerichtet.
Real-time-fähige Kostenplanungssysteme lösen diese Problematik durch die Verkürzung der Zeitspanne zwischen Kostenereignissen und der Reaktion der Geschäftsleitung. Die Echtzeit-Kostenplanung verkürzt die Reaktionszeiten von Tagen auf Minuten und ermöglicht eine Verbesserung der Gewinnspanne um 4–10 Prozentpunkte. Das ist keine geringe Verbesserung. Für eine Fabrik mit einem Umsatz von 10 Millionen Pfund erhöht eine Gewinnverbesserung um 4 Prozentpunkte die Einnahmen um 400.000 Pfund.
Kostenplattformen auf SaaS-Basis bieten einen weiteren strukturellen Vorteil gegenüber herkömmlichen On-Premise-Systemen:
“Die Minimierung der Zeit bis zur Sichtbarkeit von kosteneffizienten Ereignissen ist wertvoller als die Abhängigkeit von verzögerten monatlichen Varianzberichten.” — Dassault Systèmes DELMIA
Pro-Tipp: Bei der Einführung eines Echtzeit-Kostenzählers sollten Sie Ihr Team darauf trainieren, ein Reaktionsprotokoll für Kostendifferenzen ab einem festgelegten Schwellenwert festzulegen. Die Technologie bringt nur dann einen Mehrwert, wenn die Mitarbeiter auf die daraus resultierenden Warnmeldungen reagieren.
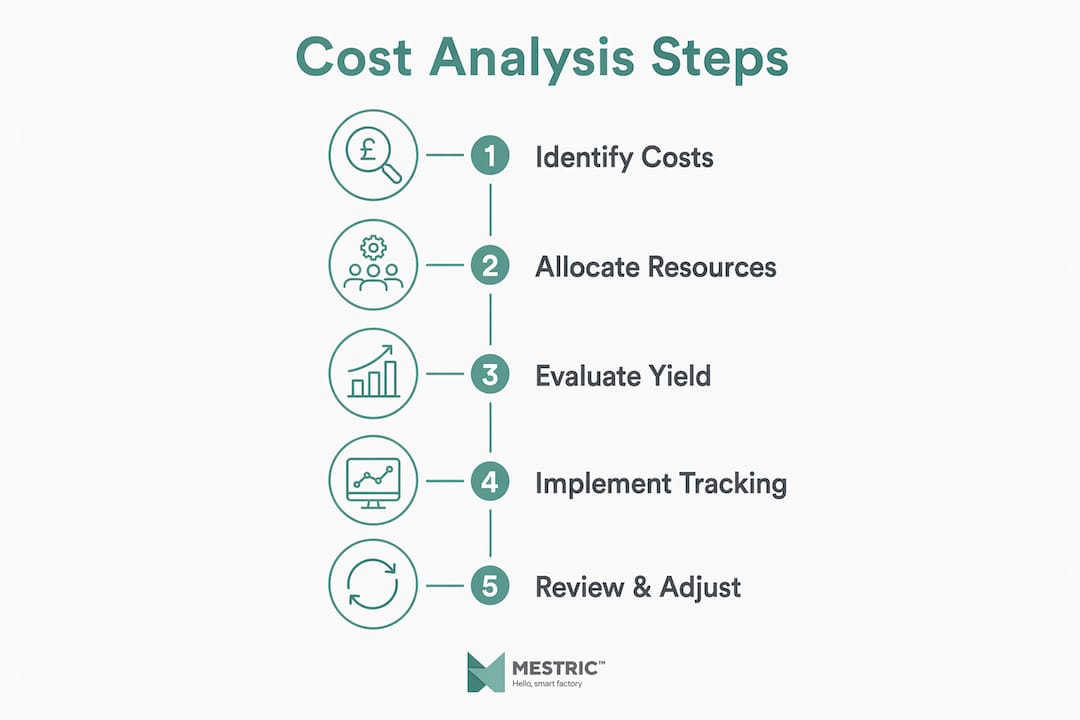
Ein strukturierter Ansatz zur Kostenanalyse für die Produktion beseitigt jegliche Vermutungen und ermöglicht ein reproduzierbares Finanzierungsverfahren. Folgen Sie diesen sechs Schritten:
Pro-Tipp: Starten Sie Ihre Kostenanalyse mit Ihren fünf umsatzstärksten Produkten. Die Ermittlung der genauen Stückkosten für diese fünf Produkte wird Ihnen mehr über Ihr Margenprofil vermitteln als eine allgemeine, aber flache Analyse des gesamten Sortiments.
Die Wahl der Kostenermittlungsmethode hat direkten Einfluss auf die gemeldeten Stückkosten und die Preisentscheidungen. Die folgende Tabelle vergleicht die drei wichtigsten Ansätze:
| Methodik | Am besten geeignet für | Vorteile | Begrenzung |
|---|---|---|---|
| Arbeitsplatzkosten | Individualisierung und Kleinseriefertigung | Präzise Kostenüberwachung pro Auftrag | Hoher administrativer Aufwand |
| Prozesskostenrechnung | Hohe Durchsatzraten bei kontinuierlicher Produktion | Geringe Betriebskosten, einfache Anwendung | Weniger detaillierte Produktkenntnisse |
| Aktivitätsbasierte Kostenrechnung | Komplexes, mehrproduktives Anlagenkonzept | Genaue Übertragungsattribution | Erfordert detaillierte Prozessdaten |
Die prozessbasierte Kostenermittlung ist eine Methode, die einzelne Fertigungsprozesse, einschließlich Zykluszeiten, Maschinenraten, Werkzeugkosten und Materialverbrauch, modelliert, um ein transparentes und verifizierbares Kostenmodell zu erstellen. Sie unterscheidet sich von historischen oder statistischen Ansätzen, die auf vergangenen Ausgabendaten basieren und weniger nachvollziehbare Ergebnisse liefern.
Prozessbasierte Schätzungen bieten Transparenz, die auf Maschinenraten, Zykluszeiten, Materialkosten und Ertragsvoraussetzungen zurückzuführen ist. Diese Rückverfolgbarkeit macht sie in Verhandlungen mit Lieferanten so wertvoll. Wenn Sie einem Lieferanten genau zeigen können, welches Kostenelement ihren angebotenen Preis bestimmt, können Sie aus dem Wissen heraus verhandeln, anstatt auf Annahmen zu setzen.
Ein häufiges Missverständnis ist, dass die prozessbasierte Schätzung einen fertigen 3D-CAD-Modell erfordert. Eine genaue Kostenermittlung erfordert kein fertiges CAD-Modell; prozessbasierte Tools generieren Schätzungen anhand der Designparameter allein. Dies bedeutet, dass die Kostenanalyse bereits in der Konzeptphase beginnen kann und die Designentscheidungen beeinflusst werden, bevor mit der Werkzeugentwicklung begonnen wird.
Die Kostenanalyse dient der spezifischen Anwendung der prozessbasierten Schätzung zur Vergleichendesung der Preisgestaltung der Lieferanten. Sie erstellt ein unabhängiges Kostenmodell für eine Komponente und vergleicht es anschließend mit den Preisangeboten der Lieferanten. Die Unterschiede zwischen Ihrem Modell und den Angeboten der Lieferanten eröffnen eine strukturierte Diskussion darüber, wo Kosten eingespart werden können – sei es durch Designänderungen, Materialsubstitution oder Verbesserung der Prozesse.
Pro-Tipp: Vor dem Beginn von Verhandlungen mit Lieferanten für Komponenten mit einem Jahresumsatz von über 5.000 £ sollten Sie eine Kosten-Nutzen-Analyse durchführen. Die Vorbereitungszeit ist gering, und das Einsparpotenzial ist beträchtlich.
Die Unterverfügbarkeit der Fabriken ist das am stärksten schädliche und am wenigsten diskutierte Kostenproblem in der Fertigung. Fabriken, die mit einer Kapazität von 50% ausgelastet sind, verzeichnen oft einen negativen Gewinn, da die Fixkosten nicht mit der Stückzahl korrelieren. Ein Werk, das für 500 Einheiten pro Tag ausgelegt ist, verzeichnet dieselben Abschreibungen, Miete und fixe Personalkosten, egal ob es 500 Einheiten oder 250 produziert. Jede Einheit unter der vollen Kapazität erhöht die Last der Fixkosten pro verkaufter Einheit.
Die verzögerte Berichterstattung verschärft das Problem. Wenn die Kostendaten erst Wochen nach der tatsächlichen Entwicklung vorliegen, können Manager keine Unterscheidung zwischen einer vorübergehenden Abweichung und einer strukturellen Kostendifferenzierung vornehmen. Das Ergebnis ist eher reaktives Handeln als proaktiver Controlling.
Das effektivste Strategien zur Kostensenkung Beide Probleme können gleichzeitig gelöst werden, indem auf Echtzeitüberwachung gesetzt und klare KPIs für Kostensteigerungsereignisse festgelegt werden. Nützliche KPIs zur Kostenkontrolle in der Fabrik sind:
Die indirekte Kostensenkung ist ein weiterer Bereich, in dem Manager oft Einsparungen verschwenden. Energieverbrauch, Wartungsplanung und Verbrauch von Verbrauchsmaterialien werden selten so genau geprüft wie direkte Materialkosten. Eine strukturierte Überprüfung der Ressourcennutzung Die Verwendung digitaler Tools kann 5–15 Prozent der indirekten Ausgaben reduzieren, ohne die direkten Produktionskosten zu beeinflussen.
Pro-Tipp: Legen Sie eine monatliche Überprüfung Ihrer Overhead-Absorbierungsrate fest. Wenn die tatsächlichen Overhead-Ausgaben immer über die absorbierten Overhead-Ausgaben liegen, sind Ihre Zuteilungsraten veraltet und Ihre Produktkosten sind unterschätzt.
Effiziente Kostenmanagementmaßnahmen in der Fabrik erfordern eine Sichtbarkeit auf Produktebene, Echtzeitdaten und eine Kostenermittlungsmethode, die auf Ihren Produktionsablauf abgestimmt ist.
| Punkt | Details |
|---|---|
| Direkte Materialien dominieren die Stückkosten | Materialien machen 30–70% des Gesamtpreises aus, was die Beschaffung und die Kontrolle der Ausbeute zu den strategisch wertvollsten Bereichen macht. |
| Die Ertragseinbußen vergrößern die fixen Kosten | Ein Verlust von 30% führt zu einem Kostenplus von 43%, daher ist die Überwachung des Ertrags je Linie und Zeiteinheit unverzichtbar. |
| Die Echtzeitkostenberechnung übertrifft monatliche Berichte | Die Reduzierung der Reaktionszeit von Tagen auf Minuten ermöglicht eine Verbesserung um 4–10 Prozent. |
| Die Wahl der Methodik bestimmt die gemeldeten Kosten | Die aktivitätsbasierte Kostenkalkulation ermöglicht die genaueste Aufteilung der indirekten Kosten in Produktionsanlagen mit mehreren Produkten. |
| Unterverfügung zerstört die Margen in stillem Gang | Werke mit einer Kapazität von 50% Mitarbeitern laufen oft unter Verlust, da die Fixkosten überlagert sind. |
Nachdem ich mit Produktionsteams in einer Reihe von Produktionsumgebungen zusammengearbeitet habe, ist das Muster, das ich am häufigsten beobachte, nicht die fehlende Datenbasis. Es liegt vielmehr an der mangelnden Klarheit auf Produktebene. Die meisten Fabriken können Ihnen ihre monatlichen Gesamtausgaben nennen. Nur sehr wenige können Ihnen die tatsächlichen Stückkosten ihrer meistverkauften Artikel nennen, einschließlich Ertragsverluste und Aufwandkosten.
Das zweite Problem ist das Change-Management, nicht die Technologie. Echtzeit-Kostenziele sind verfügbar, erschwinglich und bewährt. Das Hindernis besteht darin, die Produktionsleiter, Finanzteams und Beschaffungsteams dazu zu bewegen, sich auf eine einzige Quelle der Wahrheit zu einigen. Diese Abstimmungsgespräche sind schwieriger als die Softwareimplementierung.
Meine ehrliche Meinung ist, dass man mit einem engen Rahmen beginnen sollte. Wählen Sie drei bis fünf Produkte aus, erstellen Sie für diese präzise Kostenmodelle und nutzen Sie die Ergebnisse, um den Wert dieser Vorgehensweise zu demonstrieren. Ein schneller Erfolg bei einem Produkt mit hohem Volumen schafft die interne Glaubwürdigkeit, die für die Expansion des Programms erforderlich ist.
Die Balance zwischen Genauigkeit und Benutzerfreundlichkeit ist ebenfalls wichtig. Die aktivitätsbasierte Kalkulation ist die präziseste Methode, aber auch die anspruchsvollste zu handhaben. Für viele Fabriken bietet ein gut gepflegtes Prozesskalkulationsmodell mit regelmäßigen Aktualisierungen bezüglich Ertrag und Aufwendungen einen Wertbeitrag von 90% bei einer Anstrengung von 30%. Das Ziel ist ein Kalkulationssystem, das tatsächlich genutzt wird, und nicht ein theoretisch perfektes Modell, das unbeachtet bleibt.
— Andraž
Mestric verbindet sich direkt mit Ihrer Produktionsausrüstung und liefert dabei live wichtige Kennzahlen wie Kosten pro Einheit, Ausbeutefähigkeit, Maschinenauslastung und Ausfallzeiten – alles an einem Ort. Wenn Ihre aktuelle Berichterstattung auf Endmonats-Tabellenkalkulationen basiert, kostet Sie der Zeitaufwand zwischen einem Kostenereignis und Ihrer Erkenntnis davon Geld.

Das Fertigungsabwicklungssystem von Mestric bietet Ihnen die Echtzeit-Überwachung, die herkömmliche Berichte nicht bieten können. Entdecken Sie, wie MES vergleicht sich mit der traditionellen Fertigung Die Methoden und deren Bedeutung für Ihre Kostenkontrolle. Sie können auch die Dokumentation von Mestric überprüfen. Leitfaden zur Produktionsoptimierung Um zu sehen, wie die Daten zu Live-Kostendaten in die Planung und die Kapazitätsbeschränkungen einfließen. Vereinbaren Sie eine Vorführung vor Ort, um die Verbindung zwischen Maschinen und Ihrem Produktionsumfeld selbst zu erleben.
Die Kostenanalyse der Produktion ist die systematische Identifizierung, Verteilung und Bewertung aller direkten und indirekten Kosten in einer Fabrik, um die tatsächlichen Stückkosten zu ermitteln. Sie umfasst direkte Materialien, direkte Arbeitskosten, Gemeinkosten und Ertragseinbußen.
Ein Rückgang der Ausbeute um 30% führt zu einem Kostenplus von 43% für die fertige Einheit, da die Fixkosten über weniger verkaufsfähige Produkte verteilt werden. Die Verfolgung der Ausbeute nach Produktlinie und Schicht ist der direkte Weg, um diesen Kostenfaktor zu kontrollieren.
Die Arbeitsplatzkostenberechnung ordnet Kosten zu einzelnen Produktionsaufträgen an und eignet sich für maßgeschneiderte oder kleine Serienfertigungen. Die Prozesskostenberechnung berechnet die Gesamtkosten über eine kontinuierliche Produktionslinie und ist besser geeignet für große Serienfertigungen mit standardisierten Produkten.
Nein. Prozessbasierte Kostenermittlungswerkzeuge generieren ausschließlich aus den Designparametern genaue Schätzungen, ohne dass ein fertiges 3D-CAD-Modell erforderlich ist. Dies ermöglicht es, die Kostenanalyse bereits in der Konzeptphase zu starten und frühzeitig Entscheidungen bezüglich des Designs zu treffen.
Die Echtzeitkostenberechnung verkürzt die Wartezeit zwischen einem Kostenereignis und der Reaktion der Geschäftsführung von Tagen auf nur wenige Minuten. Diese Geschwindigkeit ermöglicht eine Verbesserung der Gewinnspanne um 4–10 Prozent, da Korrekturmaßnahmen durchgeführt werden können, bevor erhebliche Verluste eintreten.


 069 763 552