


The quickest way to cut micro-stoppages combines automated detection with constraint-focused Lean fixes, then locks in the gains with an MES such as Mestric™. Micro-downtime accounts for 57% of total production inefficiency in one sector study, so this is where the fastest returns sit.
TL;DR:
- Automated detection methods, such as signal tower sensors and vibration sensing, achieve over 85% accuracy and are essential for reliably identifying micro-stops.
- Focusing on the single worst-affected machine by applying the Five Focusing Steps can reduce micro-stops by nearly 29% through existing lean techniques.
- Most improvements, including adjusting buffers, creating SOPs, and externalizing tasks, can be implemented at no cost within a week, provided they are measured beforehand.
- Running a two-to-four-week baseline and follow-up measurement on the constrained asset ensures the validity of pilot results before scaling.
- An MES like Mestric™ streamlines data collection and offers real-time dashboards and AI suggestions to sustain gains and guide further improvements.
Micro-stoppages are easy to dismiss individually. A 20-second stop here, a 40-second stop there: none of them look like a problem on their own. Added together, they tell a different story. Micro-downtime made up 57% of total production inefficiency in a sector study, and a Lean-based intervention in that same case reduced micro-downtime and produced substantial annual savings.
Micro-downtime drives most hidden inefficiency on the shop floor: that 57% share means any team chasing throughput gains elsewhere is probably optimising the smaller part of the problem.
Manual logging makes this worse. Operators rarely write down a 15-second stop, so the paper record understates the true scale of the issue and hides exactly where the improvement potential lies. Once you start capturing these events properly, they map directly onto the KPIs you already track: OEE availability, MTBF and MTTR. Micro-stops erode availability in small, frequent bites rather than large, visible ones, which is precisely why they survive so long unaddressed.

You cannot fix what you cannot see, and manual logs miss nearly all short events. Practitioner findings show that manual logging lacks the granularity to capture sub-minute stops, which makes automated capture a precondition for reliable root-cause analysis rather than a nice-to-have.
Three practical entry points exist, each with a different cost and intrusion profile:
A validated edge-IIoT architecture using TinyML reported accuracy above 97.7% in controlled tests and above 85% in industrial cases, which makes real-time, non-intrusive monitoring practical even on legacy equipment, a technique detailed in energiemonitoring voor bedrijven. For root-cause work, each logged event needs at minimum a timestamp, machine ID, duration and a reason code; anything less and the analysis stalls later. Set data filters carefully, since too loose a threshold buries real signal in noise, and too tight a one throws away genuine short stops.
Pro tip: run a two-week sampling window with clear filtering rules before you draw any conclusions from the data.
Detection tells you where the stops happen. Diagnosis tells you why, and the Theory of Constraints gives a disciplined way to prioritise the work.
Most of the early gains cost nothing beyond time and attention. Work through these in order and measure before and after each one:
Pro tip: pair every action above with one measurable KPI, so you know within days whether it worked.
A pilot only answers the question if it is built around the right asset and run long enough to produce a stable baseline. Pick the constrained asset identified through your Five Focusing Steps work, since that is where the saved time matters most.
A combined TPM, SMED and machine learning case study raised OEE from 61.87% to 80.86% in a plastics industry plant, alongside improved MTBF and MTTR figures. A meaningful relative reduction in micro-stop time, or a comparable OEE uplift, is a reasonable threshold for a roll decision. Anything smaller suggests the pilot needs another iteration before you commit capital to scaling it.
Quick wins fade without a system to hold the gains in place. An MES needs a small, consistent set of inputs to do this work: event timestamp, machine ID, stoppage duration and a reason code, the same minimum fields discussed earlier for root-cause analysis.
Once that data is flowing, the system turns it into something a plant team can act on daily:
Integration effort is usually modest where signal tower or edge sensor data already exists, and early outcomes typically show up as better visibility within the first weeks, well before any larger process change takes hold. Pairing this with real-time monitoring practices keeps the verification loop running continuously rather than as a one-off audit.

In practice, the order matters more than the individual tools. Detect first, exploit the constraint, apply the cheap fixes, then measure with an MES before scaling anything further.
The most common mistake is skipping automated measurement and jumping straight to fixes based on gut feel, which usually lands on a low-impact machine while the real constraint goes untouched. A close second is over-configuring data filters: teams tighten thresholds to cut noise and accidentally drop the short, valid stops they set out to measure in the first place.
— Andraž
We built Mestric™ to take the guesswork out of exactly this process. Once equipment is connected, the system captures downtime automatically, surfaces it on live KPI dashboards, and applies root-cause and AI-powered recommendations to identify which micro-stops to fix first.
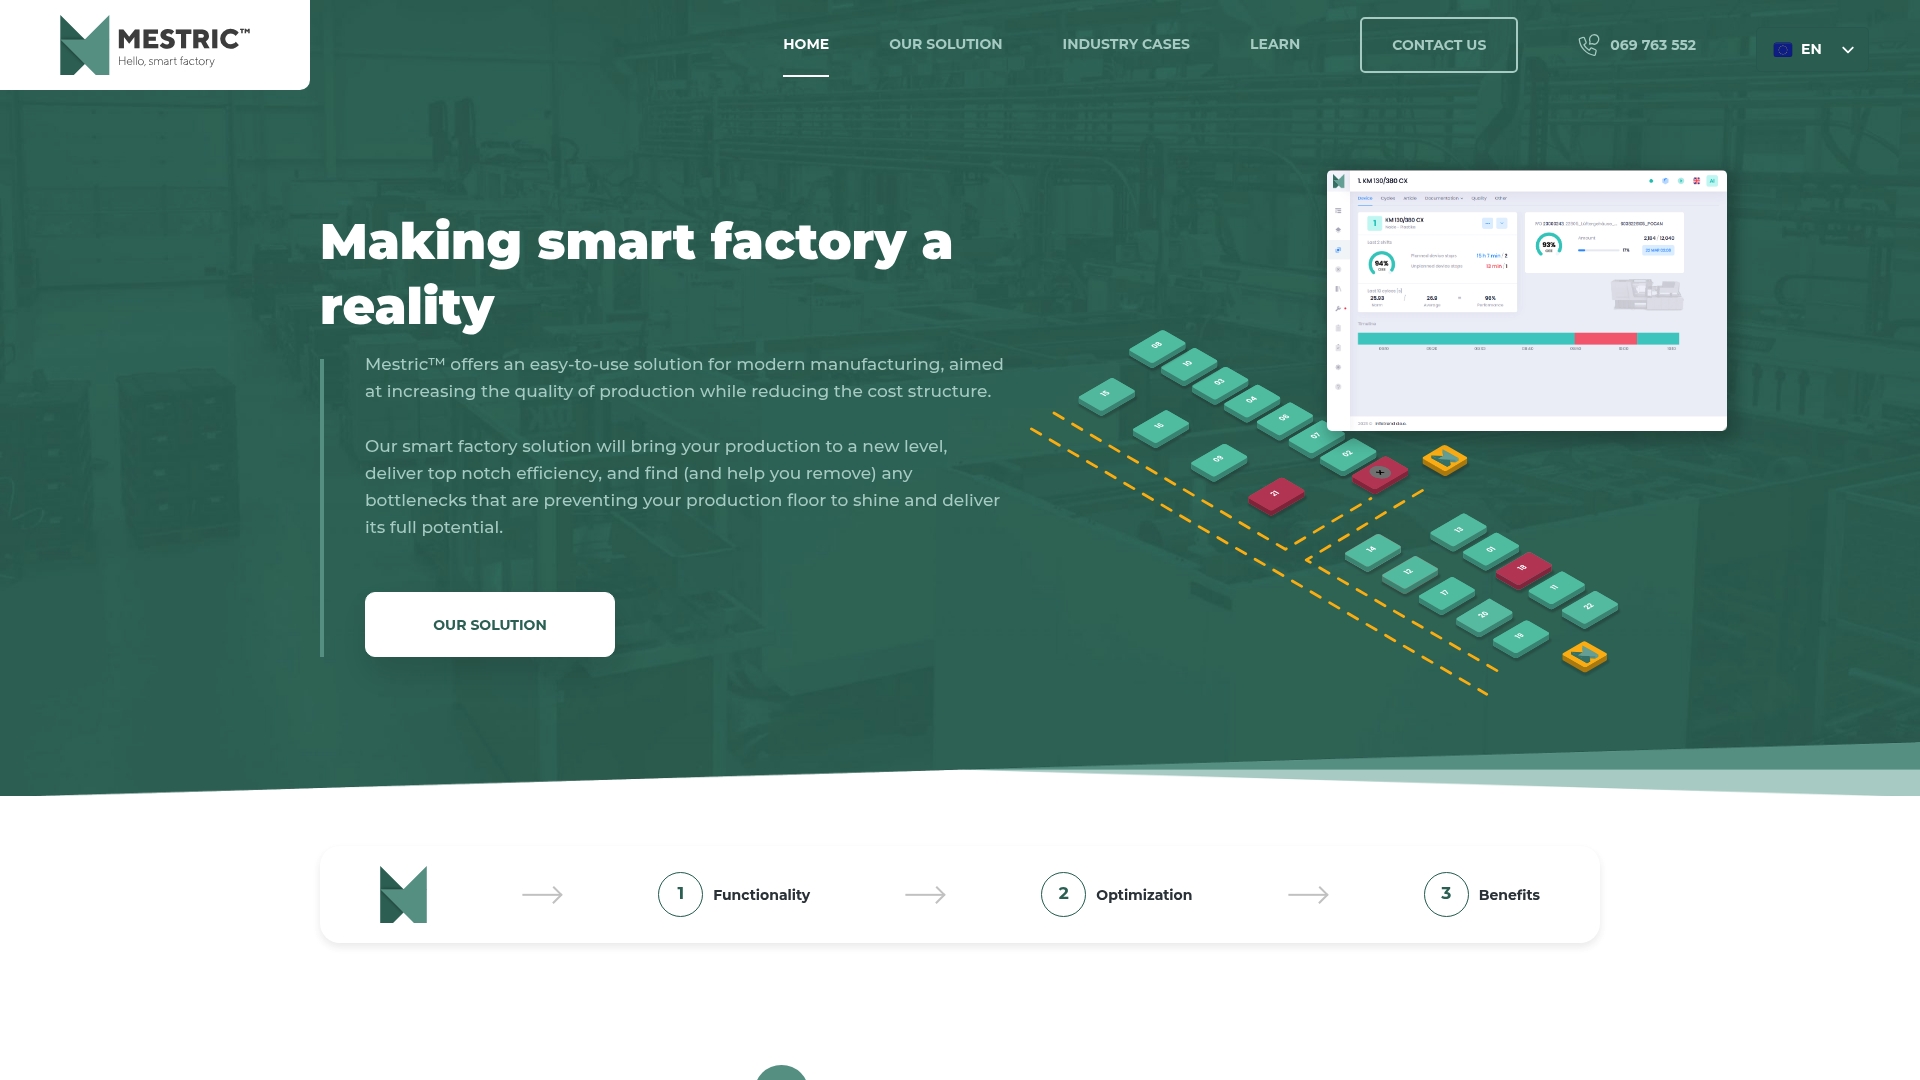
What this looks like day to day:
If you would like to see this running on a real production line, book a Mestric™ demonstration and we will walk through a pilot plan suited to your floor.
A micro-stoppage is a short machine or process halt, typically under a minute, that is often too brief for manual logs to catch. These events accumulate quickly and, in one sector study, made up 57% of total production inefficiency.
Common methods include reading signal tower states with low-cost IoT sensors, tapping PLC data directly, or using non-intrusive edge-IIoT vibration sensing. A validated TinyML approach reported industrial accuracy above 85% without needing controller access.
No single method covers every case, so combine them: use the Theory of Constraints to find the worst-affected machine, then apply TPM and SMED to fix the causes there. A combined TPM, SMED and machine learning case study raised OEE from 61.87% to 80.86%.
A reasonable pilot runs two to four weeks of baseline measurement followed by two to four weeks of intervention, tracking micro-stop count per hour and OEE delta throughout. This gives enough data to decide whether to roll the change out more widely.
Yes, Mestric™ automates downtime capture directly from connected equipment and presents it on live dashboards with reason codes and AI-powered recommendations. This replaces manual logging, which commonly misses the short events that matter most.


 069 763 552