


TL;DR:
- Production flow analysis systematically maps how materials and information move through manufacturing systems to identify constraints and waste. It reveals that most lead time is spent waiting, emphasizing the importance of focusing on the true bottleneck confirmed by cycle time versus takt time comparisons. Continuous, data-driven flow analysis enables sustained improvements and operational excellence through real-time monitoring and targeted constraint management.
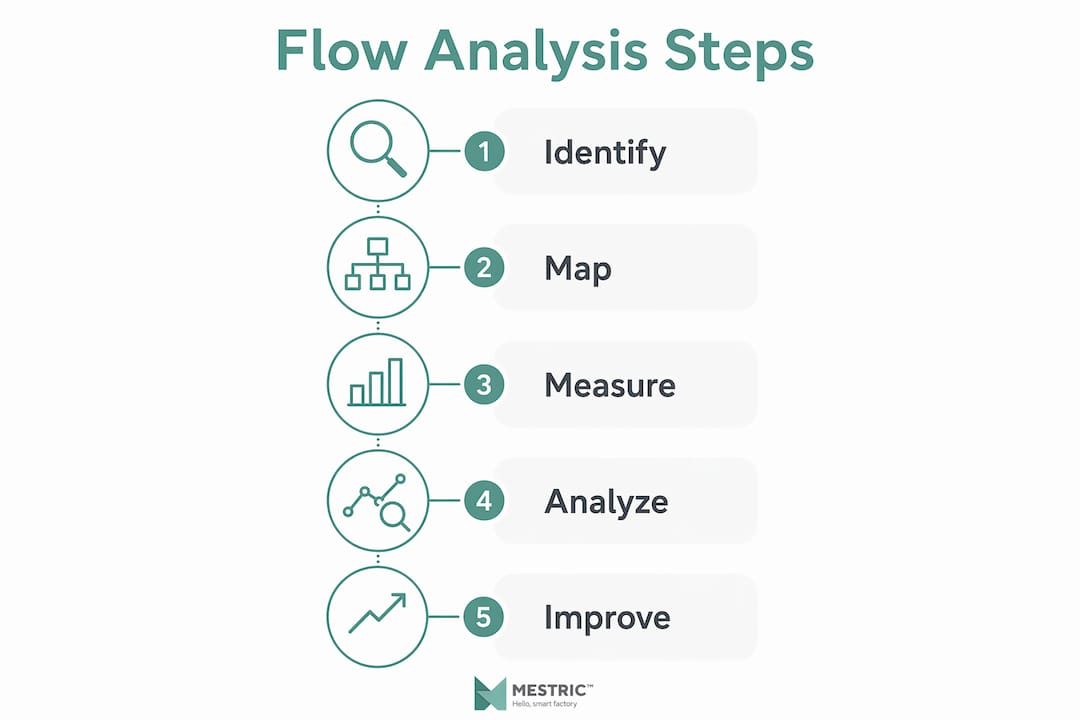
Production flow analysis is the systematic study of how materials, information, and work progress through a manufacturing system to surface constraints and inefficiencies that limit performance. Known formally as value stream analysis or material and information flow analysis, it gives you a complete picture of your operation that stepwise process reviews simply cannot provide. Tools such as Value Stream Mapping (VSM) and material and information flow diagrams plot both physical movement and scheduling signals on a single diagram, exposing delays and waste that stay invisible when each workstation is examined in isolation. For manufacturing managers and engineers, this system-wide visibility is the starting point for every meaningful efficiency gain.
Production flow analysis makes waste visible in categories that are otherwise easy to overlook: waiting time between operations, excess work-in-progress (WIP) inventory, and rework loops that consume capacity without adding value. Each category represents a direct cost, and none of them appear clearly on a single-station performance report.

The most striking finding from VSM studies is that value-added time is often less than 10% of total lead time. That means more than 90% of the time a product spends in your facility is non-value-adding waiting. Knowing this forces a shift in focus from making individual steps faster to reducing the gaps between them.
Flow analysis also gives you the data to confirm where your true bottleneck sits. Many teams assume the constraint is wherever they see the largest queue, but queue location is not proof. True bottlenecks are confirmed by comparing each process’s cycle time against the customer takt time. The step whose cycle time exceeds takt time is the constraint, and that is where improvement effort pays off most.
Key waste categories that flow analysis exposes:
Pro Tip: Prioritise improvements at the confirmed bottleneck first. Gains made anywhere else in the system do not increase overall throughput until the constraint is addressed.
Digital VSM advances this further. Modern platforms use real-time data, AI feature selection, and simulation to detect and predict bottlenecks continuously, rather than relying on a periodic manual mapping exercise. This means your flow analysis reflects actual production states rather than a snapshot taken during a single observation period.
Improving individual workstations without considering end-to-end flow is one of the most common and costly mistakes in manufacturing. Systems-level thinking is the core principle behind both the Toyota Production System and modern lean practice: a local efficiency gain that increases output at a non-constraint step simply adds to the WIP pile in front of the actual bottleneck.
Understanding why this happens requires you to look at the full picture in sequence:
This sequence prevents sub-optimisation, the trap of making one area look better on paper while degrading system performance. Subjective bottleneck identification misleads teams regularly; objective cycle-versus-takt comparison removes the guesswork.
The choice of method depends on your data availability and the complexity of your production system. The table below compares traditional and digital approaches across the dimensions that matter most to manufacturing professionals.
| Feature | Traditional VSM | Digital VSM |
|---|---|---|
| Data source | Manual observation and timing | Real-time machine and sensor data |
| Update frequency | Periodic (weeks or months) | Continuous or event-triggered |
| Bottleneck detection | Cycle vs takt comparison by hand | Automated AI-assisted flagging |
| Waste quantification | Estimated from observation | Calculated from live production records |
| Simulation capability | Limited, paper-based | Built-in scenario modelling |
| Team requirement | Cross-functional mapping workshop | Smaller team with digital platform access |
Traditional VSM remains a powerful starting point. A well-facilitated mapping workshop brings cross-functional knowledge into one room and produces a current-state map that the whole team owns. The standard symbols for process boxes, push arrows, pull loops, and inventory triangles give everyone a shared language for discussing flow problems.
Material and information flow diagrams extend VSM by placing scheduling signals, production orders, and communication routes on the same diagram as physical material movement. This combined view is where many teams first realise that their apparent capacity problem is actually a scheduling coordination problem.
Digital VSM automates the calculation of value-added versus non-value-adding times and flags performance deviations for prompt action. For high-mix or high-volume environments where conditions change frequently, this continuous update capability is a significant advantage over a quarterly mapping exercise.
OEE (Overall Equipment Effectiveness) measured at the bottleneck step quantifies recoverable capacity in three components: availability, performance rate, and quality yield. OEE metrics at the bottleneck guide targeted improvements without requiring capital investment, making them a practical first step for rapid lead time reduction.
Pro Tip: Set up continuous measurement at your confirmed bottleneck step before starting any improvement project. Without a baseline, you cannot confirm whether your changes are working or whether the constraint has shifted.
For practical guidance on applying these methods, Mestric’s resource on process mapping for efficiency covers VSM implementation in detail.
Flow analysis findings are only useful if they translate into operational changes. The following areas represent the highest-leverage applications for manufacturing managers and engineers.
Shifting from push to pull production
Pull systems reduce WIP, expose true constraints, and produce smoother flow compared to push-based scheduling. Your flow map will show you exactly where push signals are creating inventory piles. Replacing those signals with kanban triggers or FIFO lanes removes the overproduction waste at source.
Applying Theory of Constraints scheduling
TOC’s Drum-Buffer-Rope method schedules the entire system around the constraint. The bottleneck sets the drum beat, a time buffer protects it from upstream disruption, and the rope limits release of new work into the system. This approach maximises throughput without adding capacity.
Prioritising kaizen events with flow data
Flow analysis gives you an objective ranking of where improvement effort will have the greatest system impact. Rather than running kaizen events based on manager preference or the loudest complaint, you can direct teams to the steps with the highest non-value-adding time or the greatest cycle-time-to-takt-time gap.
Integrating with MES and real-time monitoring
Static flow maps become outdated quickly. Connecting your flow analysis to a Manufacturing Execution System gives you real-time production monitoring that updates your understanding of constraint location as product mix, volumes, and machine reliability change. This is particularly important because bottlenecks shift with changes in product mix, capacity, and upstream reliability.
Common pitfalls to avoid:
Combining lean tools such as SMED, 5S, and kaizen with constraint-focused improvements amplifies flow gains and sustains operational excellence over time.
Production flow analysis is the single most effective method for identifying where manufacturing systems lose time, capacity, and cost, because it examines the system as a whole rather than step by step.
| Point | Details |
|---|---|
| Value-added time is a small fraction | In most facilities, less than 10% of lead time adds value; the rest is waiting and waste. |
| Bottlenecks require data confirmation | Compare cycle time to takt time at each step; queue size alone does not identify the true constraint. |
| Information flow matters as much as material flow | Missing scheduling signals cause apparent capacity problems that are actually coordination failures. |
| Digital VSM enables continuous analysis | Real-time data and AI-assisted flagging keep flow analysis current as production conditions change. |
| TOC scheduling maximises throughput | Drum-Buffer-Rope scheduling around the confirmed constraint is the most direct path to throughput improvement. |
I have worked with manufacturing teams that spent months improving individual workstation cycle times, only to find their overall lead time unchanged. The reason is almost always the same: they optimised around the constraint rather than at it. Flow analysis is not a one-time exercise you complete and file. It is a living model of your operation, and the moment you stop updating it, it starts misleading you.
The part that most teams underestimate is information flow. I have seen facilities where the material flow was well understood but the scheduling signals were a mess of spreadsheets, verbal instructions, and ERP outputs that nobody trusted. The result was push production in disguise, with supervisors releasing work based on gut feel rather than actual downstream demand. Mapping the information flow alongside the material flow revealed the real problem within a single workshop session.
The other honest observation is that sustaining flow improvements is harder than making them. Bottlenecks shift as product mix changes, new equipment comes online, or supplier reliability fluctuates. Teams that build continuous measurement into their process, rather than relying on annual VSM workshops, are the ones that maintain their gains. Digital tools make this practical in a way that was not possible five years ago, and that shift is genuinely changing what manufacturing excellence looks like.
— Andraž
Mestric’s Manufacturing Execution System connects directly with your production equipment to give you the real-time flow data that static VSM exercises cannot provide. You can track OEE at the bottleneck, monitor WIP levels between process steps, and receive automated alerts when performance deviates from target, all from a single platform.
For teams evaluating whether an MES adds genuine value over traditional methods, Mestric’s comparison of MES vs traditional manufacturing sets out the operational and financial case clearly. If you are ready to move from periodic flow mapping to continuous flow management, Mestric offers an onsite demonstration showing exactly how connected machinery transforms production visibility.
Production flow analysis is the systematic mapping and measurement of how materials, information, and work move through a manufacturing system from raw material to finished goods. It uses tools such as Value Stream Mapping and material and information flow diagrams to expose bottlenecks, waiting time, and waste that are invisible in step-by-step process reviews.
Bottleneck identification directs improvement effort to the one step that limits overall system throughput. Improving any other step does not increase output; only addressing the confirmed constraint, verified by comparing cycle time to customer takt time, produces measurable throughput gains.
Flow analysis should be updated whenever product mix, volumes, or machine reliability change significantly, as bottlenecks shift with these conditions. Digital VSM platforms support event-triggered updates that keep your flow model current without requiring a full manual remapping exercise.
Traditional VSM relies on manual observation and periodic workshop sessions to produce a current-state map. Digital VSM uses real-time machine data, AI-assisted bottleneck detection, and simulation to update the flow model continuously and flag deviations automatically.
Flow analysis provides an objective, data-driven ranking of where improvement effort will have the greatest system impact. By combining it with lean tools such as SMED, 5S, and kaizen events focused on the confirmed constraint, manufacturing teams can sustain operational gains as conditions evolve.


