


TL;DR:
- Centralised production data consolidates machine signals, quality records, and process events into a single, governed system. It reduces manual reconciliation, speeds up root-cause analysis, and ensures consistent KPIs for regulated manufacturing. Implementing a pilot on high-value datasets like downtime or quality data accelerates adoption and improves operational efficiency.
Centralised production data is a single, unified repository that aggregates every machine signal, quality record, operator log, and process event from your factory floor into one governed system, giving every team the same real-time view of production performance. Platforms such as Mestric™ are built specifically around this model, and regulated manufacturers will recognise the principle from data integrity frameworks such as EU Annex 11 and 21 CFR Part 11, both of which require traceable, attributable records.
At a glance:
Before centralisation, staff can lose up to 12 hours per week each chasing and reconciling data from siloed systems, according to industry estimates, spending that time on coordination rather than production.
Production data is not the same as general enterprise data. Your ERP holds financial transactions, purchase orders, and HR records. Production data is what your factory floor generates: PLC outputs, SCADA alarms, historian time-series, MES batch records, quality inspection results, maintenance work orders, and operator shift logs. The distinction matters because production data is time-critical, high-frequency, and often regulated.
Centralised data management consolidates product specifications, revision histories, and quality records so all teams reference the same dataset. In a factory context, that means a single repository holds:
For regulated plants, each record must satisfy ALCOA+ principles: Attributable, Legible, Contemporaneous, Original, Accurate, plus Complete, Consistent, Enduring, and Available. Centralisation makes ALCOA+ compliance tractable because timestamps and context are captured at source rather than reconstructed later.
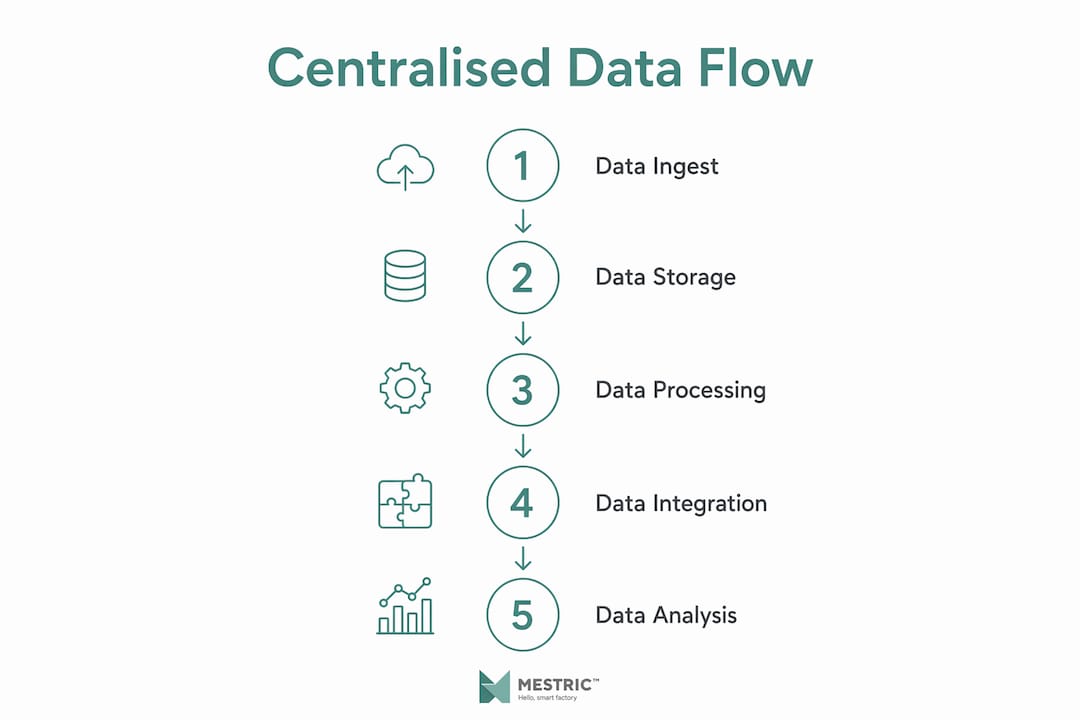
The data flow follows four stages: ingest (PLCs, HMIs, lab instruments push or stream data), store (a process historian or data lake holds raw records), normalise (a semantic or metric layer applies consistent definitions), and serve (dashboards, ERP/PLM integrations, and analytics tools consume clean, consistent data). Each stage has a natural owner: automation engineers own ingest, IT/data teams own storage, and quality or operations teams own the metric definitions.
The most immediate benefit is time. When every system holds its own version of downtime data, your team spends shift changes reconciling numbers rather than acting on them. A centralised data layer standardises definitions so finance, operations, and analytics all report the same figures, which removes the coordination overhead that quietly consumes hours every day.
Beyond time savings, the operational case is strong:
For UK manufacturers operating under GMP, ISO 9001, or IATF 16949, the audit trail benefit is particularly concrete. A centralised system can generate a complete batch record in minutes; a fragmented one requires manual collation from multiple HMIs, spreadsheets, and paper logs. The role of data in manufacturing extends directly into compliance readiness, and the time savings compound across every audit cycle.
Centralised, high-quality production data is also a precondition for AI-powered optimisation. Without a single source of truth, machine-learning models receive inconsistent inputs and return unreliable outputs. Centralisation is the necessary first step before any meaningful AI layer can be applied to your production data.
A centralised production data architecture is not a single product. It is a stack of components, each with a defined role.

Data collectors and connectors sit closest to the machine. OPC UA and MQTT are the dominant protocols for pulling data from PLCs and SCADA systems into a central layer. OPC UA is particularly well-suited to manufacturing because it carries semantic context alongside the raw value, not just a number but what that number means.
Process historian stores time-series data at high frequency. It is the system of record for process variables and is typically the first place engineers look when investigating a deviation. Historians from vendors such as OSIsoft PI (now AVEVA PI) are common in UK process industries.
MES as the production source of truth sits above the historian. An MES like Mestric™ captures work orders, batch records, operator actions, and quality results, linking them to the time-series data below. This is where manufacturing software types converge into a single operational picture.
Data lake or warehouse holds historical data for analytics. A data lake accepts raw, unstructured records; a data warehouse stores processed, structured data for fast querying. Many manufacturers use a lakehouse architecture that combines both.
Semantic or metric layer is the component most teams forget. It is where you define what “OEE” means, how “downtime” is calculated, and which shift boundaries apply. Without it, every team builds its own calculation and you are back to reconciliation arguments.
ERP and PLM integrations close the loop between the shop floor and the business. Production actuals flow up to ERP for costing; engineering changes flow down from PLM to MES for execution.
Pro Tip: Start your centralisation pilot with high-value, low-complexity datasets. Downtime events and quality inspection results are ideal: they are well-defined, directly linked to cost, and do not require complex transformation. Avoid starting with historian time-series at full resolution, which generates enormous data volumes before you have governance in place.
An iterative, pilot-first approach is consistently recommended: centralise high-value subsets first rather than attempting a full rip-and-replace. The integration priorities for 2026 reflect this, with most manufacturers starting with downtime and quality before expanding to full process historian integration.
Neither model is universally correct. The right choice depends on your factory’s speed requirements, regulatory environment, and data complexity.
Centralised production data: advantages
Centralised production data: trade-offs
When decentralisation or federation makes sense
Very high-speed local control loops (sub-millisecond PLC decisions) must remain local regardless of your central architecture. Similarly, if two sites operate under different regulatory regimes or hold genuinely sensitive IP, keeping those datasets separate may be the right call. A federated model, where each site holds its own data but a central layer provides a unified query interface, is a practical middle ground for multi-site manufacturers.

The pragmatic recommendation: centralise your critical production datasets (downtime, quality, batch records) first, adopt a hybrid or federated approach for high-speed control data and site-specific IP, and expand the central layer incrementally as governance matures.
Centralisation strengthens your compliance position, but only if the central system is built with integrity controls from the start. For UK manufacturers in regulated sectors (pharmaceuticals, medical devices, food and beverage), the relevant frameworks are EU Annex 11 (computerised systems in GMP environments) and 21 CFR Part 11 (electronic records and signatures). Both require that electronic records are trustworthy, reliable, and equivalent to paper records.
A centralised system supports these requirements directly. In regulated manufacturing, fragmented HMIs trap alarms and event logs auditors expect to see in context. Centralisation automates compliant reporting and role-based access, removing the manual collation step that introduces transcription errors and audit gaps.
Essential security controls for a centralised production data system:
Auditors will expect to see timestamp integrity (records cannot be backdated), review and approval workflows (electronic signatures where required), and documented archival processes. A centralised system makes all three demonstrable; a fragmented one makes them very difficult to prove.
Implementation does not need to be a multi-year programme. A well-scoped pilot can deliver measurable results in 6–8 weeks.
Common obstacles and how to handle them:
The value of centralised production data shows up in specific, measurable KPIs. Track these from day one of your pilot so you have a baseline to compare against.
Primary KPIs:
| KPI | Typical improvement from centralisation | Source |
|---|---|---|
| Data reconciliation time | Up to 12 hours per week saved per employee | GoConfigur |
| Engineering change cycle time | Significant reductions reported in centralised PLM workflows | Aras |
| First-pass yield | Improvements documented in centralised workflow case examples | Aras |
| Batch audit reporting | Faster generation of complete batch records vs manual collation | Metronik |
A worked ROI example: a plant with 20 production staff each spending 5 hours per week on data reconciliation (conservative, given the 12-hour estimate above) is losing 100 staff-hours per week. At an average fully-loaded cost of £35 per hour, that is £3,500 per week, or roughly £182,000 per year, before accounting for the quality and downtime improvements. A centralised system that recovers even half of that time pays for itself quickly.
For manufacturing efficiency gains, the compounding effect of consistent KPI data, faster root-cause analysis, and reduced rework typically delivers returns well beyond the initial labour saving.
Centralised production data gives manufacturers a single, governed source of truth for every machine signal, quality record, and process event, making KPI measurement consistent, compliance audits faster, and AI-driven optimisation possible.
| Point | Details |
|---|---|
| Definition | Centralised production data unifies machine, quality, and process records into one governed repository. |
| Core benefit | Eliminates up to 12 hours per week of data reconciliation per employee, freeing time for production work. |
| Pilot-first approach | Start with downtime or quality data on one line; validate for two weeks before expanding. |
| Compliance value | Centralisation supports ALCOA+, EU Annex 11, and 21 CFR Part 11 by automating audit trails and role-based access. |
| Mestric | Mestric™ provides real-time MES capabilities, quality monitoring, and KPI dashboards that connect directly to factory equipment for centralised production data management. |
Most articles on this topic focus on the technology and skip the organisational reality. The technology is the easy part. The hard part is getting three different teams to agree on what “downtime” means before you build the first dashboard.
The most common mistake I see is attempting to centralise everything at once. A plant manager hears “single source of truth” and immediately wants every PLC, every historian, every spreadsheet, and every ERP table in scope from day one. The result is a project that takes 18 months, costs three times the original estimate, and delivers nothing until the very end. A six-week pilot on downtime data from one line will teach you more about your data quality, your team’s readiness, and your governance gaps than any amount of upfront planning.
The second pitfall is ignoring the semantic layer. You can connect every system in your factory to a central platform and still end up with three different OEE numbers because each team calculates planned downtime differently. The semantic layer is where you resolve those disagreements. It is not glamorous work, but it is the difference between a dashboard everyone trusts and one everyone ignores.
The third mistake is under-investing in data governance. Who owns each dataset? Who approves changes to KPI definitions? What happens when a sensor goes offline and leaves a gap in the record? These questions need answers before you scale, not after. Mestric™ illustrates this well in practice: the platform’s real-time tracking and quality monitoring capabilities are most effective when the underlying data definitions are agreed and governed, not just connected.
Finally, do not underestimate operator engagement. Operators are the people who interact with the data every shift. If they do not trust the system or do not understand why it is there, they will work around it. Involve them early, show them how centralised data helps them do their job, and you will get better data quality as a result.
Factory teams that have spent years managing production from disconnected HMIs and spreadsheets know exactly what centralised production data costs to build from scratch: months of integration work, contested KPI definitions, and a governance framework that nobody has time to write. Mestric™ shortens that path considerably.

Mestric™ connects directly to your manufacturing equipment and aggregates real-time production data into a single MES platform, covering performance tracking, quality monitoring, downtime analysis, and cost analytics in one place. KPI dashboards are live from the moment your machines are connected, with no manual data entry required. For manufacturers comparing MES-led centralisation against traditional approaches, the efficiency case is clear: a connected MES eliminates the reconciliation overhead and gives every team the same production picture.
The typical starting point is a short discovery session followed by a pilot on one critical dataset, usually downtime or quality, with an onsite demonstration showing exactly how your connected machinery would look inside the platform. To see it in practice, book a demo with Mestric™ and bring your current KPI definitions. The conversation alone usually surfaces the data gaps worth fixing first.
The following sources informed this article and offer further reading on centralised production data and related topics.


 069 763 552