Mestric logo

Sharing is caring

Learn with us! We want to give you an easy-to-follow guide to manufacturing processes and show you the best optimization process.
Section dividerSection divider
Plant manager leading shop floor collaboration
August 1, 2026

Shop floor collaboration: a practical guide for plant managers


TL;DR:

  • Effective shop floor collaboration aligns operators, supervisors, and maintenance teams to improve productivity and quality. It relies on routines, visual KPIs, structured communication, and real-time data sharing enabled by digital tools. Focusing on leadership and cultural change is key to sustaining long-term manufacturing improvements.

Shop floor collaboration is the coordinated exchange of information, decisions, and actions between operators, supervisors, maintenance, quality, and planning teams at the point of production. When it works, shifts run to plan, problems surface and get resolved quickly, and output quality stays consistent. When it breaks down, you get repeated stoppages, rework, and the same issues appearing week after week.

Three things you can do before the next shift:

  • Run a 15-minute stand-up at shift start. Keep it to status, blockers, and one priority. No deep-dive problem solving in the room.
  • Put live KPIs where operators can see them. If your team is waiting for a supervisor to relay numbers, you already have a collaboration gap.
  • Assign one owner to each open issue. Unowned problems do not get solved; they get discussed repeatedly.

Do those three things consistently and you will see faster issue escalation and fewer repeated stoppages within a fortnight.


Table of Contents

What does shop floor collaboration actually cover?

Shop floor collaboration sits at the heart of Shop Floor Management (SFM), the discipline of overseeing and coordinating all production-floor activity in real time. SFM draws heavily on lean principles: waste reduction, standard work, visual control, and continuous improvement. Collaboration is the human layer that makes those principles stick.

Who is involved:

  • Operators — the primary source of real-time process knowledge
  • Supervisors and team leaders — coordinate across cells and shifts
  • Maintenance technicians — respond to equipment failures and preventive schedules
  • Quality engineers — monitor first-time yield, scrap, and non-conformances
  • Production planners — balance capacity, materials, and customer orders
  • Suppliers and customers — increasingly part of the loop for manufacturers pursuing mass customisation or just-in-time replenishment

Typical operational goals:

  • On-time delivery against the production schedule
  • High first-time yield with minimal rework
  • Short mean time to repair (MTTR) when equipment fails
  • Flexible response to custom or short-run orders

Manufacturers that treat collaboration as an ecosystem including suppliers and customers tend to accelerate product innovation and handle complex, customised orders more effectively than those who keep collaboration internal only.


Why better collaboration directly improves your output

The operational case is straightforward. When teams share the same live information and follow structured routines, problems get caught earlier, decisions happen faster, and the floor runs closer to plan.

Direct operational benefits:

  • Faster fault resolution because maintenance and production share the same alert at the same moment
  • Fewer quality escapes because operators flag deviations before they become batches of scrap
  • Reduced unplanned downtime through coordinated preventive maintenance scheduling
  • Lower rework costs when quality feedback loops are short

The metrics that move:

  • OEE (Overall Equipment Effectiveness) — rises as unplanned stoppages and quality losses fall
  • Cycle time — shortens when handoffs between cells are coordinated rather than reactive
  • MTTR — drops when maintenance receives live fault data rather than a verbal report ten minutes later
  • First-time yield — improves when quality data is visible to operators in real time
  • Scrap rate — falls when process deviations are caught at the source

Breaking down data silos so that operators and supervisors see the same live production, inventory, and quality data enables the coordinated, fast response that moves these metrics. You can read more about the business case for this in Mestric’s overview of shop floor efficiency gains.

Stat callout: Giving operators access to the same real-time KPIs as supervisors is one of the highest-leverage interventions available. Without data equality, operators wait for management direction, which creates waste and delays at every shift boundary.


The four core pillars of effective shop floor collaboration

Shop Floor Management combines four pillars: active on-site leadership, visualised KPIs, structured communication routines, and a culture of continuous problem solving. Each pillar has a clear owner and a measurable signal.
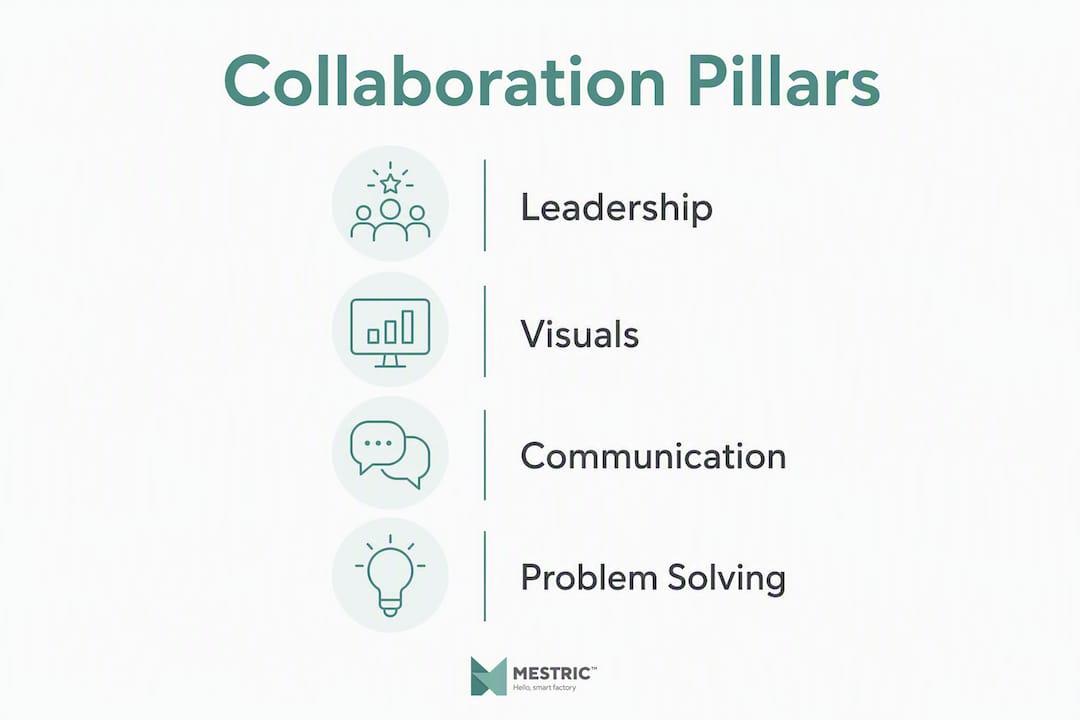
Infographic illustrating four pillars of shop floor collaboration

1. Leadership at Gemba

Supervisors and managers go to where work happens, observe, verify standard adherence, and solve problems jointly with operators. This is not an inspection round; it is a coaching conversation. The shift from directive to coaching is the single biggest cultural lever available to you.

Supervisor conducting Gemba walk on production line

2. Visual management

KPIs, production status, quality alerts, and open issues are displayed where the team works, updated in real time or at minimum each shift. A well-designed data visualisation approach removes the need for anyone to ask “how are we doing?” — the answer is always visible.
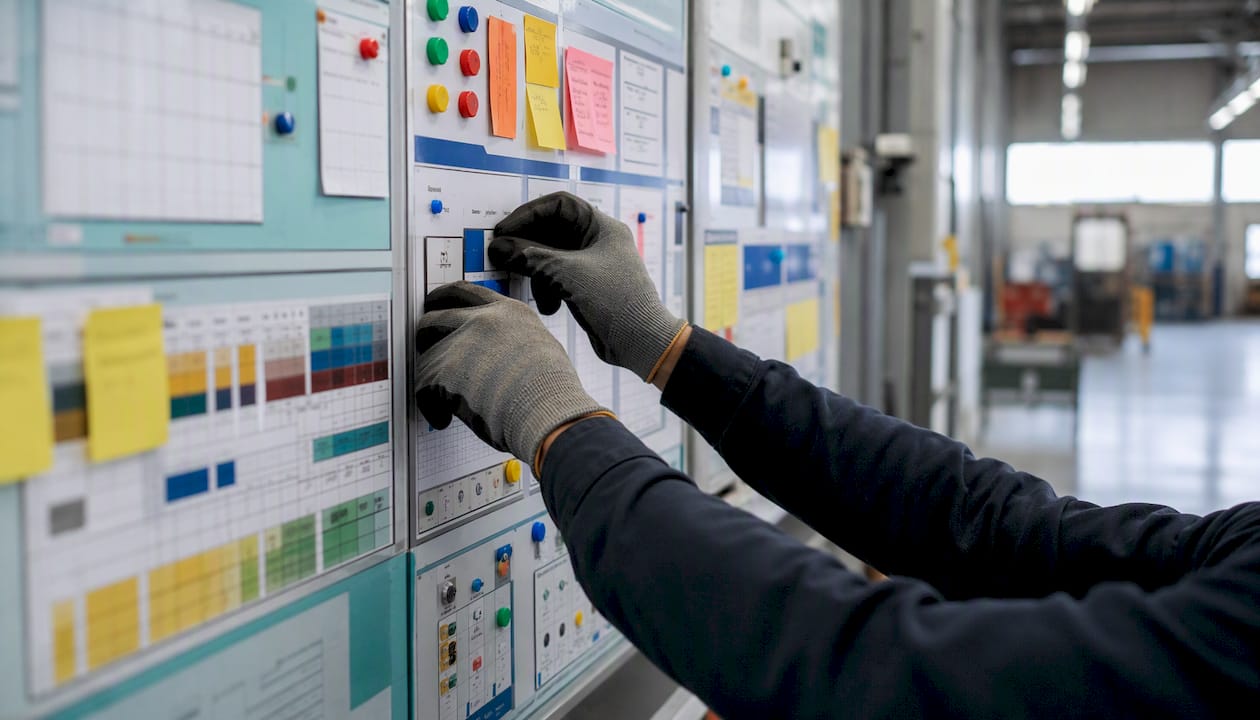
Visual management board on factory shop floor

3. Structured communication routines

The stand-up is the backbone of SFM. It keeps rhythm and transparency without pulling people off the floor for extended periods. The rule is strict: status only, clear escalation for unresolved issues, and immediate return to work. It is not a problem-solving session.

4. Continuous problem solving at the point of work

Issues are owned, logged, and resolved at the cell or line level using structured methods such as 5-Why or A3. Problems that cannot be resolved within the team are escalated with a defined owner and deadline, not left open.

Roles and responsibilities:

Role Primary action KPI signal
Operator Flags deviations, updates status board, attends stand-up Scrap rate, first-time yield
Supervisor Runs stand-up, coaches at Gemba, escalates blockers OEE, schedule adherence
Maintenance Responds to live alerts, updates MTTR log MTTR, planned vs unplanned ratio
Quality engineer Reviews yield data, closes non-conformances First-time yield, scrap rate
Production manager Reviews weekly trends, removes systemic blockers Throughput, cost per part

Pro Tip: Design your visual board around the questions operators actually ask at shift start: “Are we on plan?”, “What broke overnight?”, “What is the priority for this shift?” If the board does not answer those three questions in under 30 seconds, redesign it.


How MES, IIoT, and digital tools enable real-time coordination

Technology does not create collaboration, but it removes the friction that prevents it. The right tools give every team member the same live picture of production, quality, and equipment status without manual data entry or phone calls.

The core technology layers:

  1. MES (Manufacturing Execution System) — the central layer connecting equipment data, production orders, quality records, and workforce activity. An MES gives operators and supervisors a shared, real-time view of the floor. MES versus legacy approaches is worth reviewing if you are still running paper-based or spreadsheet tracking.
  2. IIoT sensors and PLC/SCADA integration — capture machine states, cycle counts, and fault codes automatically, feeding the MES without manual input.
  3. Digital visual boards — replace static whiteboards with live dashboards that update as conditions change, visible on screens at cell level and on mobile devices.
  4. Connected worker tools — mobile apps and tablets that give operators access to standard operating procedures, quality checklists, and escalation workflows at the machine. These tools also capture tribal knowledge and make it available across shifts, reducing the risk that expertise walks out the door when an experienced operator leaves.

Automating data sharing and alerting removes human error from manual data entry and shortens the time between an event occurring and the right person knowing about it.

Integration readiness checklist:

  • Map all data sources: PLCs, SCADA, ERP, quality systems, and any standalone spreadsheets
  • Confirm API availability or OPC-UA compatibility for legacy equipment
  • Define data governance: who owns each data stream and who can edit it
  • Set notification routing: which alerts go to which role, at what threshold
  • Agree on a single source of truth for production status — usually the MES

Pitfalls to avoid:

  • Over-digitisation without culture change. New dashboards on screens nobody checks solve nothing. The technology must be paired with the routines and governance from the four pillars.
  • Partial integrations that create new silos. A common failure is connecting some machines but leaving legacy systems offline. Integration scope should be defined by what operators need to act, not by IT convenience.
  • Alert fatigue. Too many notifications train people to ignore all of them. Start with three to five critical alerts per role and expand only when those are consistently acted upon.

Pro Tip: Before purchasing any platform, run a one-week paper simulation of your intended data flows. If the paper version does not change behaviour, the software version will not either.

Advanced manufacturing sectors such as high-performance wheel production face the same data integration challenges at scale, which illustrates how broadly these principles apply across discrete manufacturing.


A practical pilot-to-roll-out playbook

A 60–90 day pilot followed by a six-month roll-out is the most reliable path. It limits risk, generates evidence, and builds the internal credibility you need to secure budget for the full programme.

Phase timeline:

Phase Duration Objectives Owner Success criteria
Preparation Weeks 1–2 Map current data flows, select pilot cell, define KPIs Production manager + IT Baseline OEE and MTTR documented
Pilot Weeks 3–10 Stand-ups, visual board, one MES/IIoT integration Supervisor + engineer Stand-up attendance high, KPI trend visible
Review Weeks 11–12 Measure pilot KPIs vs baseline, document lessons Production manager Decision to proceed with evidence
Roll-out Months 4–9 Extend to all cells, full MES integration, training Plant manager + IT Floor-wide KPI dashboard live, MTTR reduced

60–90 day pilot checklist:

  1. Select one cell or line with a willing supervisor and a clear baseline problem (high scrap, frequent stoppages, or poor schedule adherence).
  2. Document current-state data flows: where does production status live today, and who updates it?
  3. Design a simple visual board (physical or digital) answering the three shift-start questions from the pro tip above.
  4. Introduce the 15-minute stand-up. Run it daily for four weeks before changing anything else.
  5. Connect one data source to a shared dashboard — even a single machine’s cycle count is enough to demonstrate the principle.
  6. Log every open issue with an owner and a due date. Review weekly.

Six-month roll-out milestones:

  • Month 4: Stand-up routine embedded across all shifts; visual boards live in every cell
  • Month 5: MES integrated with primary production equipment; automated alerts active
  • Month 6: Quality and maintenance data feeding the same dashboard as production
  • Month 7: First monthly trend review with management; KPI baselines updated
  • Month 8: Connected worker tools deployed; standard operating procedures digitalised
  • Month 9: Full review against original baseline; business case for next investment phase

Typical budget bands (UK context):

  • Low (£15,000–£40,000): Physical visual boards, stand-up facilitation, and a lightweight digital dashboard using existing ERP data exports. Suitable for a single-cell pilot.
  • Medium (£40,000–£120,000): Cloud-based MES with IIoT sensor integration for a production line or small facility. Includes implementation support and training.
  • High (£120,000+): Full-facility MES deployment with PLC/SCADA integration, connected worker tools, and ongoing analytics. Typically requires a phased procurement over 12–18 months.

Procurement tips: Request a structured pilot or proof-of-concept period from any vendor before committing to a full licence. Define success criteria in writing before the pilot starts, not after.


Common mistakes that derail collaboration programmes

Most collaboration initiatives do not fail because the tools are wrong. They fail because the leadership behaviours and governance structures are not in place to sustain them.

Common pitfalls:

  • Top-down mandates without operator involvement. If operators did not help design the stand-up format or the visual board, they will not own it. Involve them from day one.
  • Ignoring the 15-minute rule. Stand-ups that drift to 45 minutes become resented. Protect the time limit rigorously — escalate unresolved issues to a separate session, not the stand-up itself.
  • Noisy, unactionable alerts. Dashboards that flash warnings nobody acts on erode trust in the whole system. Every alert must have a defined response owner.
  • Unclear escalation paths. Operators who flag a problem and see nothing happen will stop flagging. Every issue needs a visible status and a named owner.
  • One-off training. Teaching operators why a tool exists is as important as how to use it. Training must be continuous and role-focused, not a single session at go-live.
  • Expecting software to change culture. Tools are enablers, but success requires coaching-led leadership that privileges transparency and operator empowerment. The technology follows the behaviour, not the other way around.

Red flags during pilot:

  • Stand-up attendance below 70% after week three
  • Visual board not updated by mid-shift
  • The same issue appearing on the open-issues log for more than two weeks without progress
  • Supervisors using stand-up time to assign blame rather than coordinate action

Leadership checklist for sustained adoption:

  • Attend Gemba at least twice per shift, with a coaching question rather than a directive
  • Protect the 15-minute stand-up as a non-negotiable daily rhythm
  • Publicly close resolved issues on the visual board — visible wins build participation
  • Empower operators to own problems at cell level; escalate only what genuinely needs management input

Pro Tip: If you notice supervisors skipping Gemba visits when production is running well, that is the moment to reinforce the habit. Gemba is most valuable when nothing appears to be wrong — that is when you catch the early signals.


Which KPIs should you track, and how often?

Five KPIs cover the vast majority of what shop floor collaboration is trying to improve. Track all five, but prioritise the two or three most relevant to your current biggest loss.

Priority KPIs:

  • OEE — the composite measure of availability, performance, and quality. Use it as your headline number; drill into its components to find where to act.
  • Cycle time — actual versus standard. Persistent gaps signal either a process problem or a coordination failure between cells.
  • MTTR — how long it takes to restore equipment after a fault. High MTTR usually means maintenance and production are not sharing fault information in real time.
  • First-time yield — the proportion of units passing quality checks without rework. Falling yield is often the first visible signal of a process drift that operators have already noticed but not yet escalated.
  • Scrap rate — the cost of quality failures. Track by product, shift, and cell to identify patterns.

Tracking the right production KPIs from the start of a pilot gives you the baseline evidence you need to demonstrate ROI at the review stage.

Visualisation approach:

  • Shop floor board (cell level): Current shift status, open issues, today’s target vs actual. Updated every two hours minimum.
  • Digital dashboard (line or facility level): Live OEE, MTTR, and yield trends. Visible on screens at supervisor level and accessible on mobile.
  • Executive summary (weekly/monthly): Trend lines, cost impact, and progress against improvement targets. Generated from the same data source as the shop floor board.

Review cadence:

  • Daily stand-up: Status and blockers. No trend analysis.
  • Weekly follow-up (30 minutes): Review open issues, check KPI trends, adjust priorities.
  • Monthly trend review (60 minutes): Compare against baseline, assess whether pilot objectives are being met, decide on next actions.

Escalation rule: any KPI that moves more than 10% below its rolling four-week average triggers an immediate owner assignment and a root-cause review within 48 hours.

Stat callout: When operators and supervisors share the same live KPI view, the time between a fault occurring and a coordinated response shortens significantly — because no one is waiting for a report that has not been written yet.


What research and practitioner experience show

The evidence base for structured shop floor collaboration is consistent across lean manufacturing literature and modern digital transformation research.

Key findings:

  • Integrating legacy control systems with a unified MES reduces miscommunication by giving all stakeholders access to the same live production, inventory, and quality data. The implication: integration is not an IT project; it is a collaboration intervention.
  • SFM’s four pillars (on-site leadership, visualised KPIs, structured routines, continuous problem solving) are validated as the core framework for effective production-floor coordination. Organisations that implement all four consistently outperform those that adopt only one or two.
  • Supervisors who transition from director to coach — using Gemba presence for observation and joint problem solving rather than instruction — see higher operator engagement and faster issue resolution.
  • Collaboration that extends to suppliers and customers enables faster systemic innovation and supports complex manufacturing such as mass customisation, a growing requirement in UK discrete manufacturing.

A consistent pattern across practitioner accounts is that the first measurable gains appear not from technology deployment but from the stand-up routine alone. Teams that run a structured daily huddle for four weeks before any digital tool is introduced report faster issue escalation and clearer shift priorities. The technology then amplifies a behaviour that already exists, rather than trying to create one from scratch.


Key takeaways

Shop floor collaboration improves when leadership, routines, data visibility, and continuous problem solving work together as a system rather than as isolated initiatives.

Point Details
Start with routines, not tools Run a structured 15-minute stand-up daily for four weeks before deploying any new technology.
Data equality is the highest-leverage intervention Give operators access to the same live KPIs as supervisors to cut response time and reduce waiting.
Track five KPIs from day one OEE, cycle time, MTTR, first-time yield, and scrap rate cover the main collaboration-driven losses.
Run a 60–90 day pilot before full roll-out Select one cell, document the baseline, and measure KPI movement before committing to facility-wide investment.
Mestric supports every pillar Mestric’s MES connects equipment data, quality records, and KPI dashboards in one platform, giving teams the shared live view that collaboration depends on.

The part most managers underestimate

The most common mistake I see in collaboration programmes is treating the technology decision as the primary one. Managers spend weeks evaluating MES platforms and digital boards, then wonder why adoption stalls six months after go-live. The technology was fine. The stand-up was not protected. Supervisors were still issuing directives at Gemba rather than asking questions. Operators had no visibility of whether their flagged issues were being acted on.

The research is clear on this: coaching-led leadership that privileges transparency and operator empowerment is the success factor that separates sustained programmes from failed ones. Tools are multipliers. If the underlying behaviour is directive and opaque, a better dashboard multiplies that problem.

The shift that tends to produce the fastest results is deceptively simple: stop using the stand-up to report upward and start using it to coordinate sideways. When operators and supervisors are solving problems together in real time rather than passing information up a chain, the floor starts to self-correct. That is the goal. The technology, the boards, and the KPIs are all in service of that one change.

If you are starting from scratch, protect the 15-minute rule before you buy anything else. It costs nothing and it will tell you more about your team’s collaboration readiness than any diagnostic tool.


How Mestric supports your collaboration programme

Real-time performance tracking is where most collaboration programmes stall without the right platform behind them. Mestric connects directly with your production equipment, pulling live OEE, cycle time, MTTR, and quality data into a single dashboard that every role on your floor can see, from operator to plant manager.

Mestric

Each of the four SFM pillars maps directly to a Mestric capability: Gemba visits are supported by mobile KPI access; visual management is handled through configurable live dashboards; structured routines are reinforced by automated shift reports and alert routing; and continuous problem solving is enabled by root-cause analytics and quality monitoring tools. You get real-time performance tracking without the manual data entry that slows most teams down.

If you are planning a pilot, Mestric’s onsite demonstration shows exactly how connected equipment feeds the dashboards your supervisors and operators will use daily. Book a demonstration to see the platform in your production context and get a clear picture of what a 60–90 day pilot would look like for your facility.


Useful sources and further reading

  • An Introduction to Shop Floor Management — SafetyCulture: A practical primer on SFM covering communication routines, process confirmation, and continuous improvement culture. Good starting point for managers new to the discipline.
  • Shop Floor Management: definition and best practice — Tervene: Detailed coverage of the four SFM pillars and the coaching-leadership model. Useful for structuring your own implementation framework.
  • Shopfloor Management explained — TeamThink: Explains the 15-minute rule, escalation structures, and the cultural conditions that make SFM stick. Particularly useful for pitfall avoidance.
  • How to improve cross-team collaboration on the shop floor — Kato Integrations: Covers data integration, alert design, and the data equality principle. Relevant for the technology and implementation sections of any programme.
  • Recognising the importance of collaboration in modern manufacturing — Forbes Business Council: Makes the case for extending collaboration to suppliers and customers. Useful context for UK manufacturers pursuing mass customisation or supply chain resilience.
  • Four tips to improve collaboration in manufacturing — Hexagon Manufacturing Intelligence: Covers connected worker tools, tribal knowledge capture, and continuous training. Practical guidance for the technology deployment phase.

crossmenu