

Countless operations managers still wrestle with old assumptions about manufacturing data, leading many facilities across Germany, Canada, and Japan to miss out on efficiency gains. The real power of manufacturing data lies in its ability to drive faster, smarter decisions, yet misconceptions—from believing analytics is too costly to fearing complexity—hold back progress. This article breaks down the meaning of manufacturing data and debunks myths, offering practical guidance for mastering data-driven decision-making and real-time factory performance tracking.
| Point | Details |
|---|---|
| Understanding Manufacturing Data is Crucial | Manufacturing data includes machine readings, process metrics, and quality assessments that enable informed decision-making on the factory floor. |
| Common Misconceptions Impact Operations | Many manufacturers mistakenly believe that data analytics are only for large corporations or that perfect data is necessary, hindering progress. |
| Real-Time Data Integration Enhances Efficiency | Connecting manufacturing systems in real time allows for immediate visibility of operations, enabling swift responses to issues as they arise. |
| Data Quality and Integration are Key Challenges | Poor data quality and disconnected systems lead to unreliable insights and decision-making; overcoming these barriers is essential for successful data adoption. |
Manufacturing data is simply information captured from your production environment—machine readings, process parameters, quality measurements, and operational metrics. It is the raw material that drives informed decision-making on the factory floor.
Many operations managers hold onto outdated beliefs about what data can and cannot do. These misconceptions often prevent manufacturers from adopting the systems and practices that could transform their operations significantly.
Data in manufacturing refers to quantifiable information collected from equipment, processes, and quality systems. This includes performance metrics, downtime records, production counts, and defect rates. When properly managed, this data becomes actionable intelligence.
Real manufacturing data comes from multiple sources:
The key difference between traditional manufacturing and data-driven operations is visibility. You move from guessing why a line slowed down to knowing exactly when and why it happened.
Manufacturing data transforms reactive problem-solving into proactive optimisation—you catch issues before they impact production schedules.
Manufacturers often believe that leveraging data and analytics is too expensive. This assumption blocks progress because initial barriers are typically overstated. Manufacturers of all sizes can benefit from data-driven approaches without massive capital investments.
Another misconception is that your organisation lacks the capability for data analysis. Many operations managers assume they need specialised teams of data scientists. In reality, modern systems handle the heavy lifting—you focus on reading insights and making decisions.
Some believe that managing manufacturing data is unnecessarily complex. The truth is that understanding data’s nature, quality, and management best practices is simpler than most assume. Purpose-built manufacturing systems simplify this process considerably.
Here are the most damaging misconceptions:
Older manufacturing systems did not provide real-time visibility, so many operations managers simply never experienced data’s power firsthand. Legacy thinking lingers. You grew accustomed to making decisions with incomplete information, and that becomes the baseline expectation.
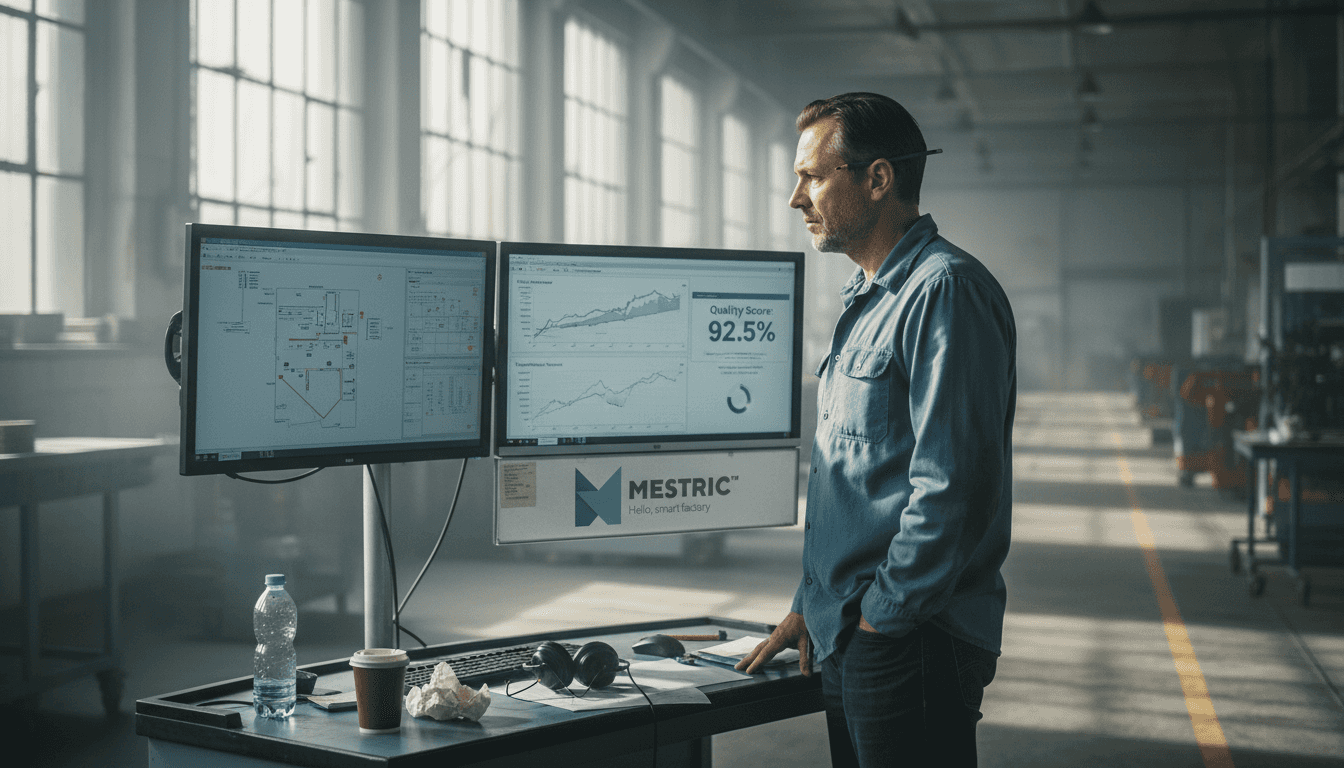
The reality is different. When production managers can view performance metrics, downtime, quality parameters, and cost analysis in real time, decisions become faster and more accurate.
Pro tip: Start small by tracking one critical metric—your slowest production line or highest defect rate—and watch how visibility transforms your problem-solving speed and accuracy.
Manufacturing data comes in many forms, and understanding what you can collect matters as much as how you collect it. Different data types serve different purposes—some reveal process health, others highlight quality issues, and still others drive cost optimisation.
The data you gather today shapes the decisions you make tomorrow. Choosing the right collection methods ensures you capture meaningful information without creating unnecessary complexity on your shop floor.
Process data tracks how your equipment performs. This includes machine speed, temperature, pressure, cycle time, and parameter settings. It tells you whether processes run within specification or drift toward problems.

Quality data measures output against standards. Defect rates, dimensional accuracy, surface finish, and inspection results fall here. This data identifies where quality breaks down and why.
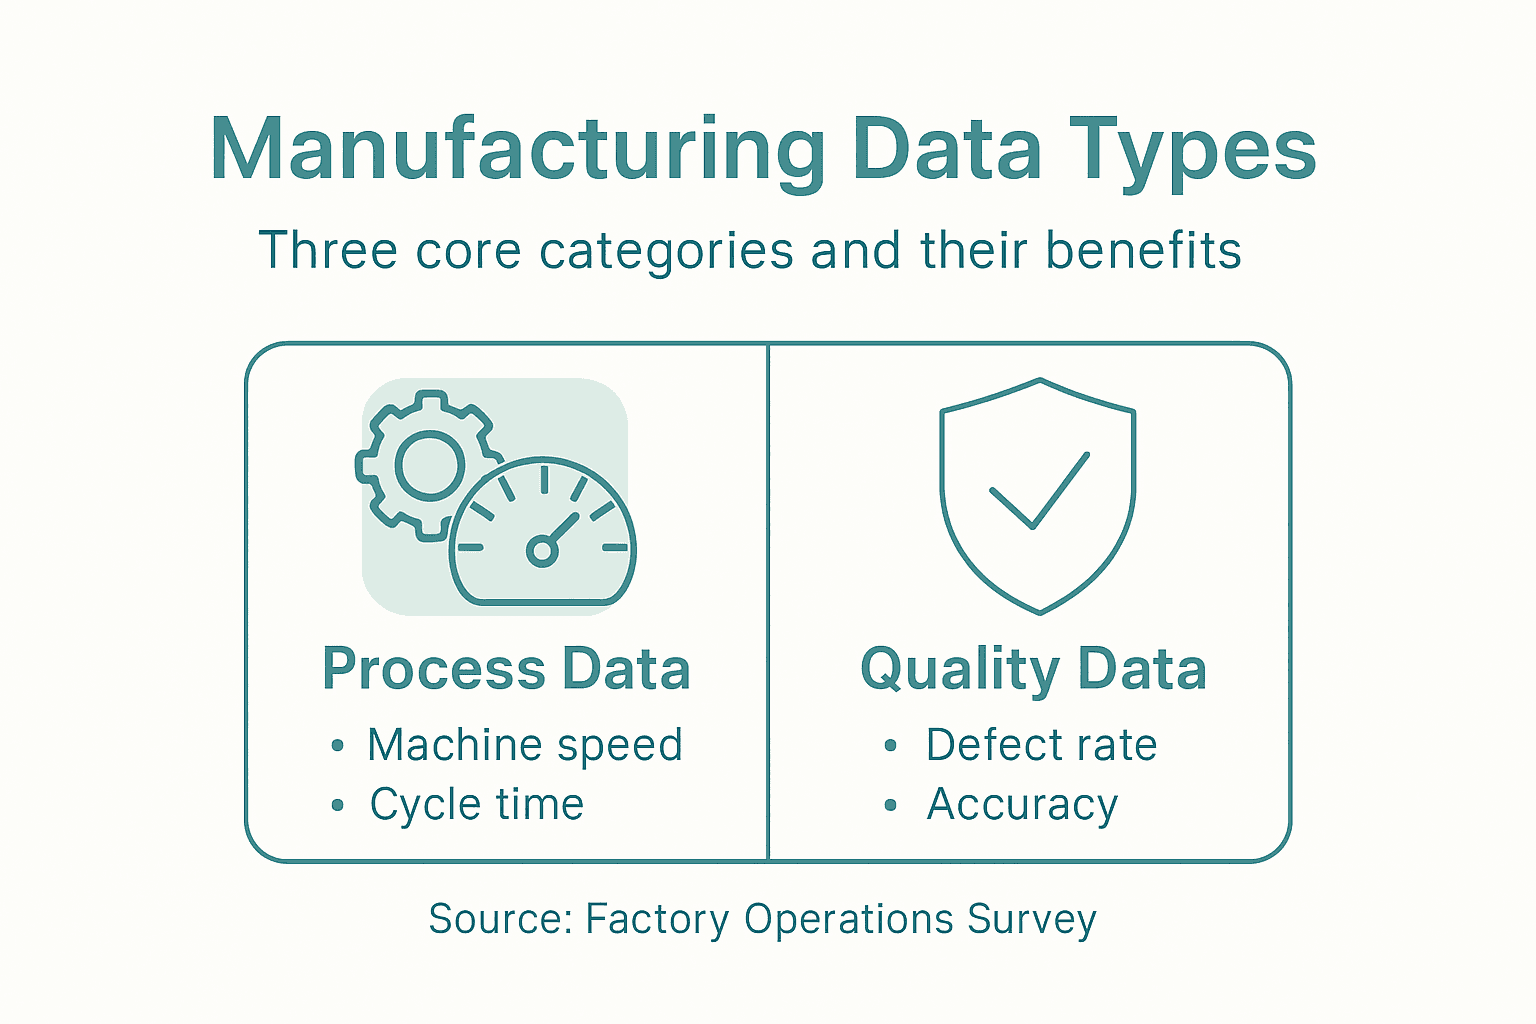
Operational data covers everything else—downtime events, material usage, energy consumption, labour hours, and scheduling information. It reveals inefficiencies and resource bottlenecks across your facility.
These three categories interlock. A quality defect (quality data) might stem from a process parameter drift (process data) caused by equipment degradation (operational data).
Here is a summary of key types of manufacturing data and their typical business benefits:
| Data Category | Typical Data Collected | Business Insight Provided | Example Benefit |
|---|---|---|---|
| Process Data | Machine speed, temperature | Identifies deviations in production | Reduces process variability |
| Quality Data | Defect counts, measurements | Highlights root causes of defects | Cuts scrap and rework costs |
| Operational Data | Downtime, material usage | Reveals resource bottlenecks | Improves equipment utilisation |
The most valuable manufacturing data connects process behaviour to business outcomes—you see not just what happened, but why it matters.
Advanced sensoring technologies enable direct measurement of process parameters in real time. Modern factories increasingly rely on sensors integrated into machinery rather than manual recording. This removes human error and provides continuous visibility.
Manual data entry still exists and remains necessary for certain information. Operator observations, material batch records, and inspection findings often require human judgment. The key is knowing when to automate and when to trust people.
Network-based solutions connect machines, sensors, and systems into a unified data ecosystem. Instead of isolated data islands, best practices for data collection emphasise adherence to international standards. This ensures consistency whether you manufacture in one facility or across multiple countries.
Common collection approaches include:
You don’t need every method. Start with what reveals your biggest operational challenges. If downtime plagues your operation, invest in downtime tracking first. If quality drives customer returns, prioritise quality data collection.
Below is a comparison of common data collection methods in manufacturing:
| Collection Method | Automation Level | Data Accuracy | Suitable Use Case |
|---|---|---|---|
| Integrated Sensors | High | Very high | Continuous machine monitoring |
| Manual Operator Input | Low | Variable | Subjective or visual checks |
| IoT Devices | Moderate to high | High | Environmental data collection |
| Vision Systems | High | High | Automated quality inspection |
Manufacturing data extends beyond your production floor. You can capture information at design, production planning, manufacturing, quality testing, and even customer return stages. Each stage reveals different insights about product performance and process capability.
Integrating lifecycle data helps you understand root causes. A recurring customer complaint might trace back to a design specification, a process window drift, or a material supplier change. Without connected data across these stages, you remain in the dark.
Pro tip: Begin by mapping your three biggest operational pain points—whether downtime, quality escapes, or inefficiency—then select collection methods that directly address those specific problems rather than attempting to capture everything at once.
Real-time data integration connects your shop floor directly to your Manufacturing Execution System. Instead of waiting for end-of-shift reports, you see production performance as it happens. This immediacy transforms how operations managers respond to problems.
When machines, sensors, and systems communicate in real time, delays disappear. You catch quality issues before they cascade, spot downtime before it compounds, and optimise parameters before waste accumulates.
Your MES platform sits at the centre of your data ecosystem. Equipment sends production data continuously—cycle times, defect counts, parameter changes, maintenance alerts. The MES collects, contextualises, and displays this information instantly.
Industrial IoT (IIoT) integration with MES automates sensor-based data generation and feeds it into your systems automatically. Sensors attached to machines transmit readings every few seconds. Your MES aggregates these signals and translates them into actionable insights.
This eliminates manual data entry bottlenecks. Operators no longer record production counts on paper or spreadsheets. Data flows directly from source to system, removing transcription errors and delays.
Real-time visibility means you respond to problems in minutes, not hours—the difference between contained issues and widespread downtime.
Without real-time data, troubleshooting becomes guesswork. A line stopped at 2:15 p.m.—was it mechanical failure, material jam, or operator error? By the time you investigate, the context fades. With real-time integration, you see exactly what happened and when.
Predictive maintenance becomes possible. Rather than waiting for equipment failure, you monitor performance trends. When a bearing temperature creeps upward or vibration increases, you schedule maintenance proactively. This prevents surprise breakdowns that derail schedules.
Quality control improves dramatically. You spot defect patterns as they emerge rather than discovering problems in finished goods inspection. If dimensional drift appears in a batch, you adjust parameters immediately instead of scrapping hundreds of units.
Operational efficiency gains compound. Real-time KPIs reveal bottlenecks instantly. You see which workstations slow down, which materials cause rework, which shift performs best. Data-driven decisions replace intuition.
Key capabilities include:
MES 4.0 evolution incorporates IoT, Big Data, and Cloud Computing to achieve real-time vertical integration. However, real-time systems require reliable infrastructure, clear data governance, and cyber security measures. Plan these foundations before deploying sensors across your facility.
Start with critical production lines. Rather than installing hundreds of sensors simultaneously, begin where you face your biggest operational challenges. A line with frequent downtime or quality issues provides clear ROI for real-time monitoring.
Pro tip: Identify your three KPIs that matter most to profitability—whether cycle time, defect rate, or equipment availability—then ensure your MES integration captures these metrics in real time before expanding to secondary measurements.
Data transforms from raw numbers into business value through three interconnected applications. Monitoring shows you what’s happening now. Optimisation improves what you’re doing. Analytics reveals why things happen and predicts what comes next.
These three work together. You monitor a process, spot inefficiencies through analytics, then optimise parameters to eliminate waste. Each cycle compounds your competitive advantage.
Real-time monitoring means watching your manufacturing floor continuously rather than reviewing yesterday’s reports. When a machine’s performance drifts, you see it immediately. When defects emerge, you catch them before they propagate.
Monitoring covers three critical areas:
Without monitoring, problems hide until they damage schedules or products. A spindle bearing gradually heating means nothing until it fails catastrophically. Dimensional drift looks harmless until inspection rejects entire batches.
IoT and advanced analytics in manufacturing operations enable real-time data stream monitoring for productivity improvements. Your MES platform aggregates sensor readings, equipment logs, and quality data into unified dashboards. Operations managers see status at a glance rather than hunting through spreadsheets.
Continuous monitoring catches small problems before they become expensive disasters—the difference between minor adjustments and production shutdowns.
Optimisation uses data to improve what you’re doing. Rather than guessing which parameter setting works best, you let data guide decisions. This removes opinion from process improvement.
Process optimisation adjusts machine parameters based on real performance data. If reducing cycle time by 2 seconds improves throughput without sacrificing quality, you implement it systematically. If a material supplier change affects surface finish, you adjust polishing duration accordingly.
Resource optimisation allocates people, materials, and equipment more efficiently. Data reveals which workstations become bottlenecks, which shifts produce highest quality, which materials waste most. You redirect resources toward highest-impact areas.
Energy optimisation reduces consumption and costs. Data-driven methodology for monitoring and optimisation through analytics utilises high-resolution consumption data to classify machine states and estimate energy costs. When you see which processes consume most energy, you target those for improvement.
Optimisation approaches include:
Analytics answers the “why” questions that monitoring and optimisation cannot address alone. Why does one shift produce fewer defects than another? Why do certain production runs cause rework? Why is equipment degrading faster than expected?
Descriptive analytics looks backward—what happened. You analyse historical data to understand patterns. Predictive analytics looks forward—what will happen. You use patterns to forecast maintenance needs, material requirements, and capacity constraints.
Analytics enables:
When combined, these applications create a self-improving manufacturing system. You monitor constantly, spot inefficiencies through analysis, optimise continuously, then measure the impact. Each cycle builds on previous learning.
Pro tip: Start your analytics journey by identifying your three costliest problems—whether rework, downtime, or material waste—then build monitoring and optimisation efforts around those specific pain points rather than attempting comprehensive improvement everywhere at once.
Building a data-driven operation sounds straightforward until you actually try it. Real factories face messy reality—disconnected equipment, inconsistent data quality, organisational resistance, and technical complexity. Understanding these challenges helps you navigate them successfully.
Every manufacturing operation encounters obstacles when transitioning to data-driven decision-making. Recognising them early prevents costly mistakes and frustration.
Garbage in, garbage out. If your data is inaccurate, incomplete, or inconsistent, your insights become unreliable. Heterogeneous data quality and complexity in data integration represent fundamental challenges in industrial data science maturity across global manufacturing contexts.
Data quality issues emerge from multiple sources. Manual data entry introduces human error. Legacy equipment transmits inconsistent formats. Different facilities use different measurement standards. Sensors drift over time without recalibration.
Poor data quality cascades through your entire operation. You make decisions based on flawed information. Predictive models train on unreliable patterns. Optimization efforts target false problems.
Addressing data quality requires:
Data quality determines whether your insights drive improvement or perpetuate mistakes—investing in accuracy pays dividends across every decision.
Data silos develop when systems don’t communicate. Your quality system stores defect data. Your maintenance system tracks equipment failures. Your production system records cycle times. Each lives in isolation.
When data stays siloed, you cannot see complete pictures. Why did quality drop last Tuesday? Was it the new material batch, equipment degradation, or operator inexperience? Without integrated data, you’re guessing.
Data silos and reliance on spreadsheets plague manufacturing operations globally. Breaking down silos requires connecting disparate systems—often a technical and organisational challenge.
Integration barriers include:
Breaking silos demands investment in middleware, standardisation, and governance. Start by connecting your highest-priority systems first rather than attempting comprehensive integration everywhere.
Technology alone doesn’t drive data adoption. Your team must understand data, trust it, and act on it. Many operations managers grew up making decisions through experience and intuition. Shifting to data-driven approaches requires cultural change.
Common barriers include:
Overcoming these requires stakeholder involvement, training, and demonstrated success. Show your team early wins where data drove measurable improvement. Build confidence gradually.
Pro tip: Select one small process pain point—perhaps a single production line’s quality issues—and solve it completely with data and analytics, then showcase the results to your entire operation to build momentum and trust for broader data-driven transformation.
Manufacturers seeking to overcome common challenges like data silos, poor data quality, and disconnected systems will find a powerful ally in Mestric™. This easy-to-use Manufacturing Execution System directly addresses the need for real-time performance tracking, quality monitoring, and predictive insights highlighted in the article “Role of Data in Manufacturing: Driving Efficiency and Quality.” By integrating seamlessly with your machinery and capturing critical KPIs, Mestric™ transforms raw manufacturing data into actionable intelligence, enabling you to catch issues early and optimise operations effectively.
Experience clear benefits such as:
Boost your manufacturing operations today by exploring how Mestric™ can deliver measurable improvements in efficiency and product quality. Visit Mestric™ digital platform to schedule a demonstration and start your journey towards data-driven manufacturing excellence. Discover how connected machinery and real-time analytics create a smarter production floor that works for you.
Manufacturing data refers to quantifiable information collected from production equipment, processes, and quality systems. It includes metrics such as performance measurements, downtime records, quality assessments, and operational metrics that inform decision-making on the factory floor.
Data improves manufacturing efficiency by providing real-time visibility into operations, enabling proactive problem-solving, identifying bottlenecks, and optimising processes based on empirical insights rather than guesswork.
Common misconceptions include the belief that data is only beneficial for large corporations, that perfect data is required, and that implementing data-driven systems takes significant time and resources. In reality, facilities of all sizes can benefit, data can be messy, and many modern systems deploy quickly.
Real-time data integration connects shop floor activities directly with Manufacturing Execution Systems (MES), allowing for continuous monitoring of production performance, immediate response to issues, and improved decision-making based on timely insights.


