

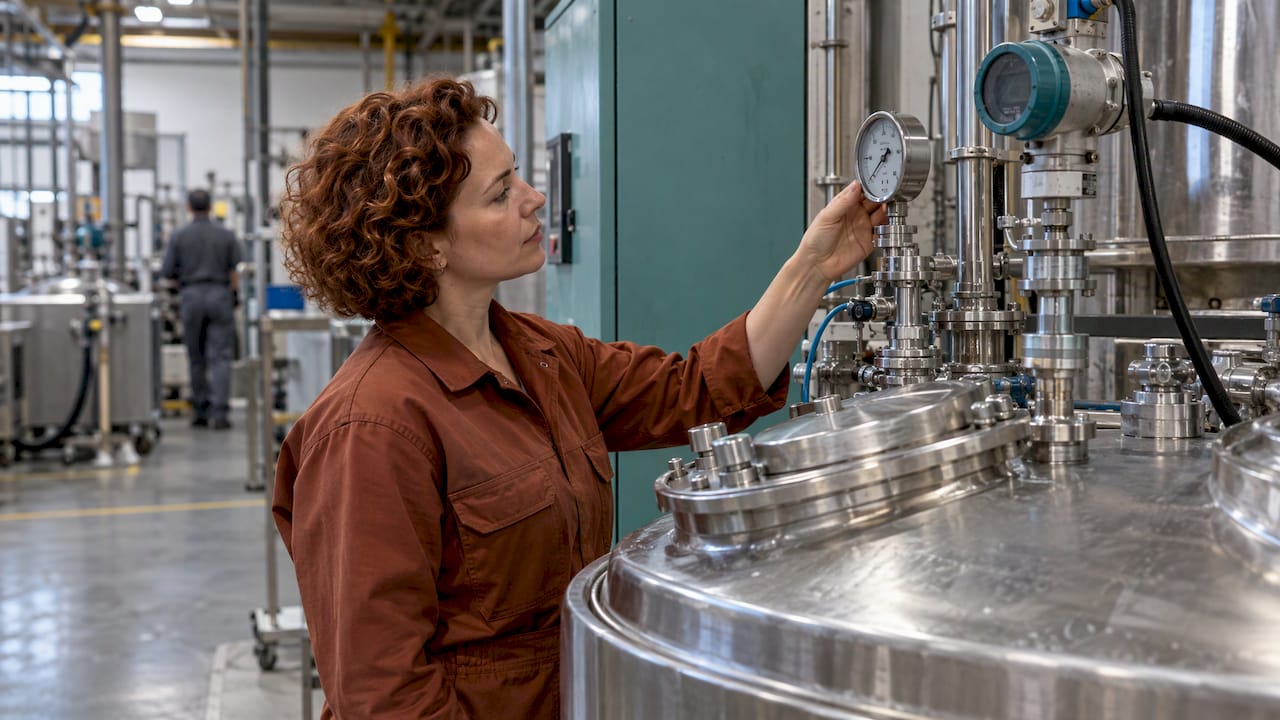
Process parameter monitoring means watching the measurable variables of a production process, such as temperature, pressure, speed, cycle time or reject rate, and acting when they drift outside agreed limits. Done well, it turns raw machine signals into early warnings. You find the problem while it is still a deviation, not yet a batch of scrap or a customer complaint. This guide shows you which parameters to pick, how to set limits, how to react to alarms and how to keep the records that ISO 9001 and food-safety rules expect.
Process monitoring is the continuous or periodic observation of a process to verify that it runs within the desired conditions and to detect deviations before they become failures or quality defects. According to the IEEE Technology Navigator, it covers collecting sensor measurements, applying statistical or model-based analysis, and generating alarms or control actions when the process leaves its normal behaviour. The same source notes that undetected faults can lead to off-specification product, equipment damage or hazardous conditions.
For a plant manager, that translates into three practical questions:
Slovenian manufacturers are already moving in this direction. In its 2025 company magazine, Impol describes digitalisation as more than introducing new systems: real-time data monitoring supports smarter decisions and better control over energy consumption and process safety.
More signals do not mean better control. A dashboard with 200 tags hides the three that matter. The LearnChemE process monitoring guide advises selecting variables that show different, uncorrelated phenomena, so you do not watch the same event through five sensors. If you are unsure which variable is most informative, it suggests using a multivariate monitoring approach.
A workable shortlist usually mixes four groups:
| Group | Examples | What it tells you |
|---|---|---|
| Process conditions | Temperature, pressure, flow, speed, torque | Whether the process runs inside its recipe |
| Machine state | Running, stopped, micro-stops, changeovers | Where time is lost |
| Product quality | Dimensions, weight, defect counts, scrap | Whether the output meets specification |
| Resources | Energy per unit, material use, cycle time | What each good part costs |
If you supply automotive customers, check the requirements that apply to you. As explained in a summary of IATF 16949:2016 clause 9.1.1.1, process capability must conform to what was documented in the PPAP submission or agreed with the customer in writing. The managers responsible for corrective action must be informed promptly of nonconformities. Productivity, cycle time, waste, errors and asset utilisation are typical indicators of process effectiveness.
For help turning this into plant-level measures, see our examples of how to select effective production KPIs and the quality KPIs used in manufacturing operations.
The quality of the monitoring depends on the quality of the data. Three habits matter most.
Capture automatically, close to the source. Manual logging introduces transcription errors and delays. Reading values directly from machines gives you consistent timestamps and removes the clipboard step. Our guide on integrating digital MES solutions with equipment walks through this step.
Keep the delay short. The LearnChemE guide points out that the monetary value of the information in a monitoring chart decays exponentially from the moment an event occurs. A problem seen yesterday is hard to diagnose and correct, and one that happened last week or last month is harder still. A chart should therefore show the quantity as close to real time as possible. This is the core argument for real-time production monitoring.
Know your measurement basis. A sensor that drifts, a gauge that is out of calibration or a unit mismatch between two machines will produce limits that are wrong from the start. Check the instruments before you build limits on their output. This is also part of ISO 9001, which expects suitable resources for monitoring and measuring (clause 8.5.1).
Limits taken from a datasheet describe what the equipment can do. Limits taken from your history describe what your process actually does. The LearnChemE guide recommends a clear sequence:
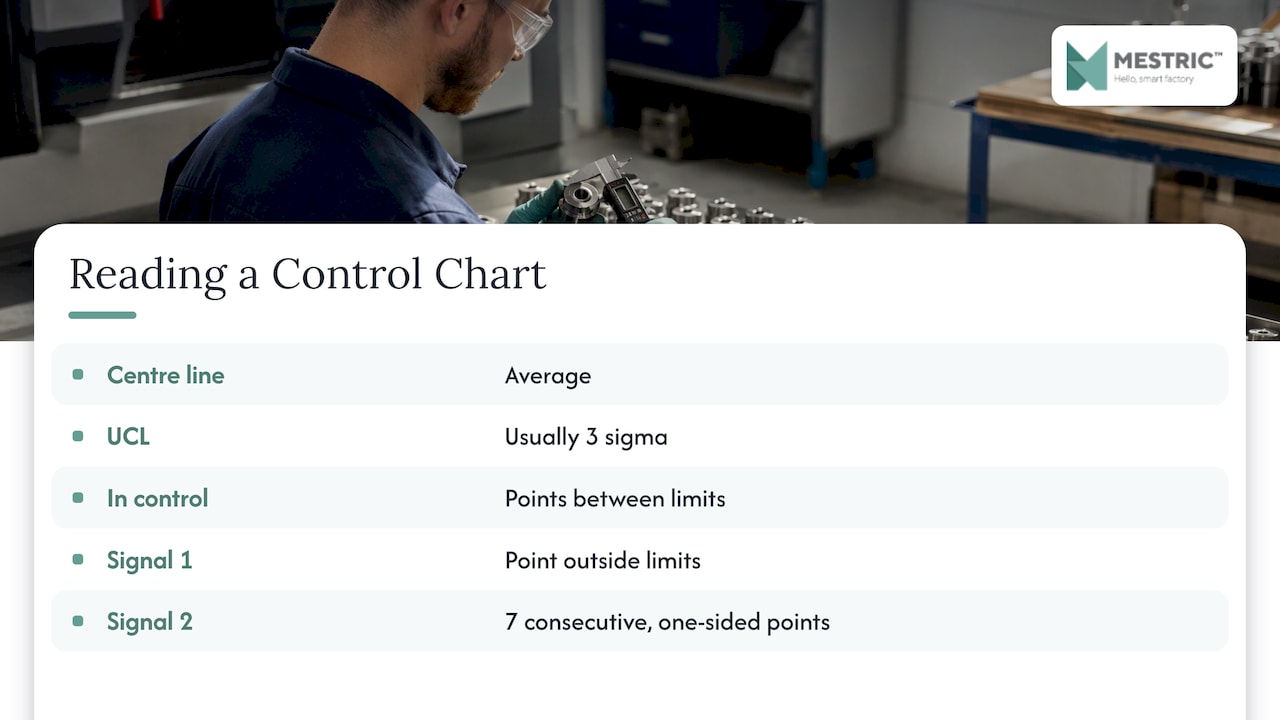
A control chart plots measurements over time against three lines: the centre line (the average), the UCL and the LCL. As Fabrico’s SPC guide explains, the UCL is usually set at three sigma. While points stay between the limits the process is considered in control. A point outside them, or seven points in a row on one side of the centre line, signals that the process needs attention.
Statistical process control (SPC) follows three phases: understand the process and its specification limits, remove assignable sources of variation so the process is stable, then monitor ongoing production with charts to detect significant shifts in mean or variation, as summarised on Wikipedia. Note the order. Charts on an unstable process produce noise, so stabilise first.
Specification limits come from the customer or the drawing. Control limits come from process behaviour. A process can sit inside specification and still drift, and the control chart is what shows the drift early. Keep both on the same screen so operators see how much margin is left.
Once limits exist, the job is to make deviations visible to the right person at the right moment. A good setup has these elements:
If you are designing alarms for the first time, our 30–90 day alarm pilot for plant managers describes how to model alarms at the source and expand once they work. For a wider view of how the data feeds decisions, read about automating monitoring and tracking real-time KPIs.
The response should be the same every time, not improvised by whoever is on shift. A simple response routine for the first half hour:
This mirrors the idea in the FitGap guidance that the first response should be deterministic. After containment, ISO 9001:2015 clause 10.2.1 sets out the longer sequence. The organisation must control and correct the nonconformity and deal with its consequences. It must then evaluate the need to eliminate the causes by reviewing the nonconformity, determining its causes and checking whether similar ones exist or could occur. Any needed action is implemented, its effectiveness is reviewed, and risks and opportunities are updated if necessary. The full text is in the ISO 9001:2015 standard.
For a practical walk-through of how this fits a quality routine, see quality control in practice, step by step, which links measurement and evaluation to ISO 9001 requirements.
In food businesses, monitoring has a legal side. Bureau Veritas Slovenia notes that the HACCP system is legally prescribed for all food businesses in Slovenia. Among its principles are critical limits for each critical control point (KKT), a monitoring system at each point and corrective actions when monitoring shows a deviation, so that no potentially non-compliant product is sold.
The European Commission’s 2022 guidance defines monitoring as a planned sequence of observations or measurements of control parameters to assess whether a control measure is under control. Corrective action is any action taken on a deviation to re-establish control, segregate and decide on the affected product, and prevent or minimise recurrence. A Slovenian example from LI-JA Storitve describes regular measurement and recording of refrigerator temperatures and checking the core temperature of cooked food. Without such monitoring you cannot tell whether a control point is under control.

If your plant also handles packaging, curtains or sealing in hygiene-sensitive areas, this overview of HACCP documentation requirements shows what auditors expect to find on file.
Monitoring that leaves no trace cannot be audited or learned from. ISO 9001:2015 clause 9.1.1 requires documented information as evidence of monitoring and measurement results. Clause 10.2.2 requires evidence of the nature of nonconformities, the actions taken and the results of any corrective action. The EU guidance adds that a HACCP plan must be updated when production changes and supplemented with records of monitoring, verification and corrective actions.
A review rhythm that works in most plants:
Our quality monitoring workflow guide and examples of quality monitoring show how teams structure this in practice.
Most failed monitoring projects fail for organisational reasons, not technical ones. These are the issues we see discussed most often.
| Problem | Why it hurts | What to do |
|---|---|---|
| Too many parameters | Important signals are buried | Start with the few that drive quality and downtime, add later |
| Too many alarms | Operators stop reacting | Alarm only on abnormal, actionable conditions; review nuisance alarms weekly |
| Limits copied from datasheets | False alarms or missed drift | Estimate from cleaned plant data and test them |
| Unreliable data | Trust in the system collapses | Check sensors and calibration first; capture data automatically |
| No owner for a deviation | Alarms are seen but not handled | Name the responsible role in each alert |
| Records kept separately | Audit preparation takes days | Store results and actions in the same system as the live data |
| Nobody revisits limits | Charts go stale as the process changes | Schedule a regular limit review |
A useful starting rule: begin with one line or one product, prove the routine works, then replicate it. A narrow pilot gives you real numbers on false alarms and response times before you scale.
We built Mestric around one observation: most plants already measure a lot, but the numbers reach the people who can act too late, or never reach them at all. Parameters sit in machine controllers, in spreadsheets and on paper, and nobody sees them together.
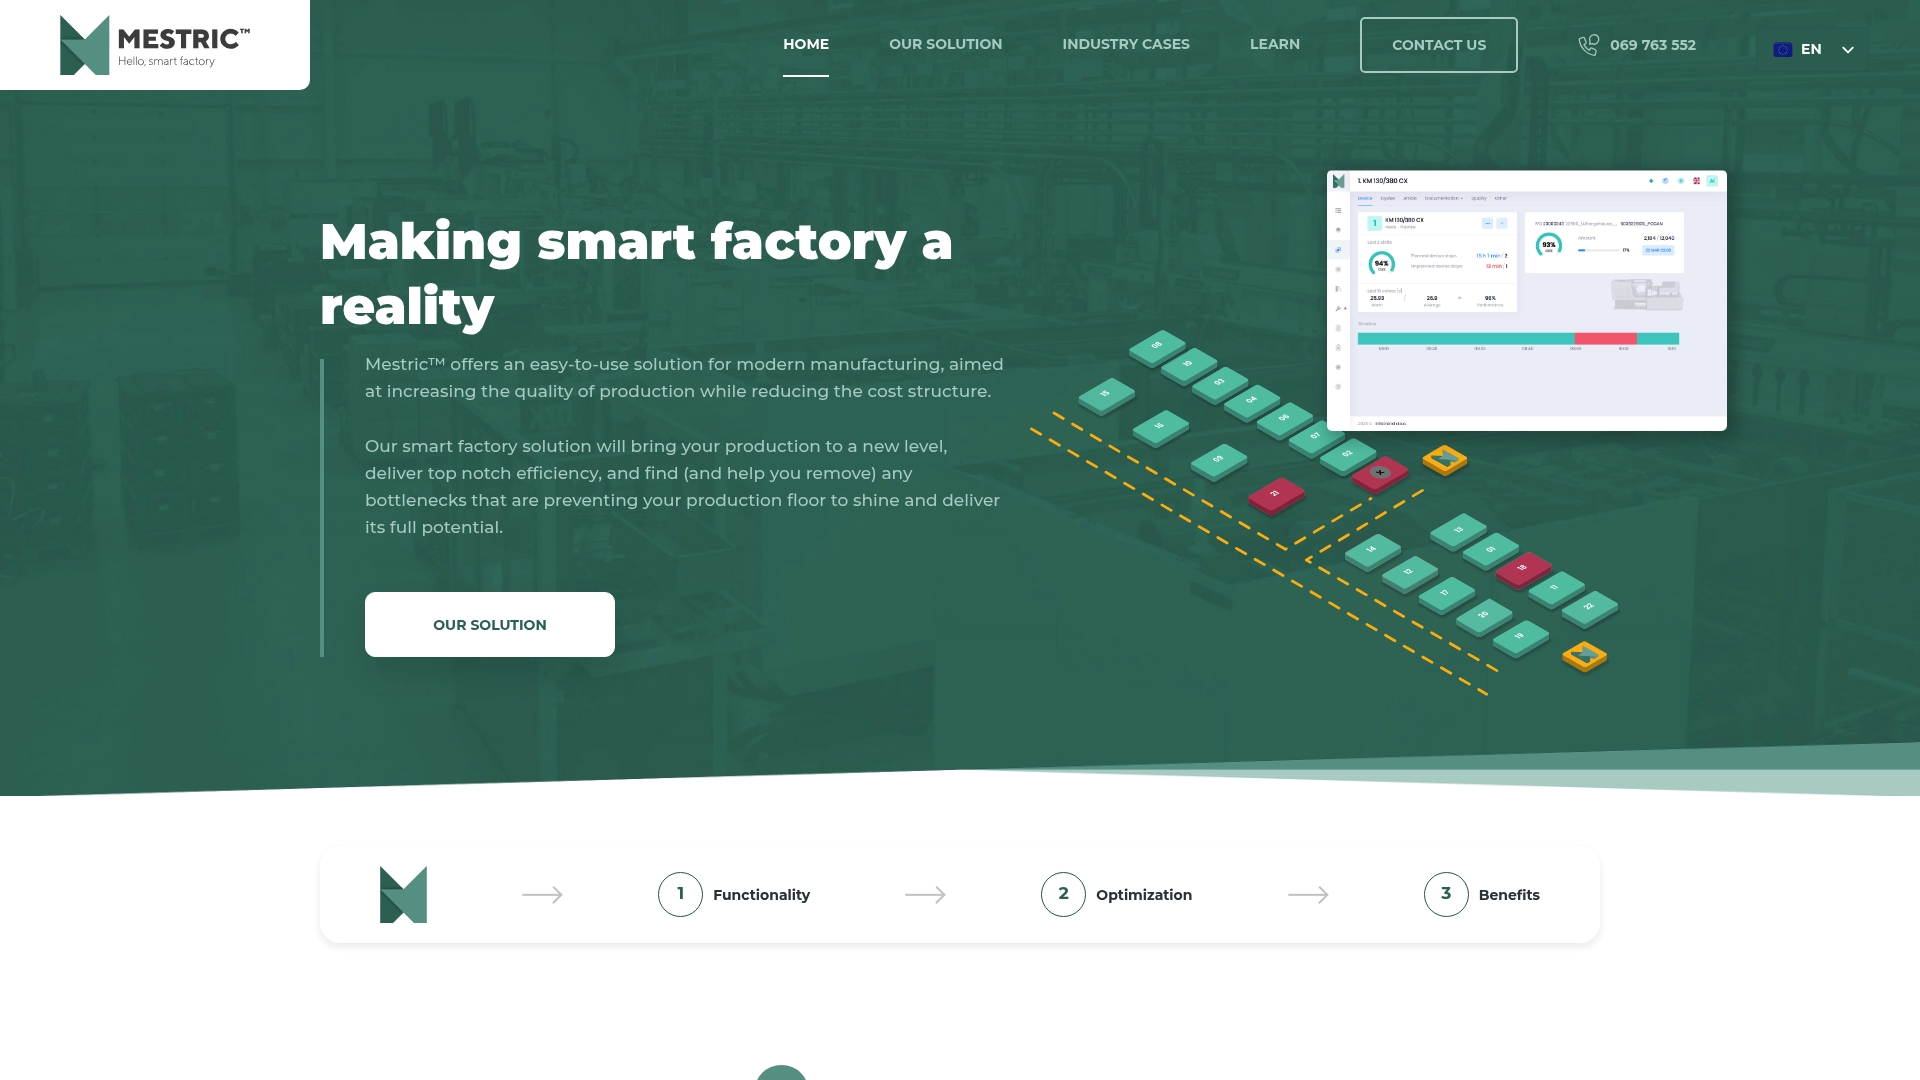
That is why Mestric connects directly with manufacturing equipment and collects data automatically. Performance, downtime, quality parameters and cost appear as KPIs in one place, so a production manager sees a deviation while it can still be corrected. Our AI-powered tools then point to bottlenecks and suggest where process norms can be improved, which supports decisions with data instead of intuition.
We also believe that ease of use decides whether monitoring survives. A system that operators understand at a glance gets used on every shift. That is the standard we design for, and it is why we offer a demonstration in a real production environment, so you can see connected machines at work before you decide anything.
Andraž
Mestric™ MES connects to your machines and gives production managers live KPIs for performance, downtime, quality parameters and costs, with AI-powered optimisation on top. It is designed to reduce manual errors, find bottlenecks and support faster, better-informed decisions. You can see how this works with an onsite presentation of connected machinery in a real production setting.
Read more about the Mestric™ MES platform or explore AI process parameter recommendations to see how parameter targets can be refined with data.
Start with the few that most strongly affect quality and downtime on your highest-value line. Choose variables that describe different phenomena, so you do not duplicate information. Add more once the first set produces actionable alerts.
Use cleaned historical data from stable operation. Estimate the limits from about 60% of it and test them on the remaining 40% and on known unusual events. Adjust until false alarms and missed detections are balanced acceptably, then review the limits regularly.
Monitoring observes the process and signals when it drifts. Control acts on the process, automatically or through people, to bring it back. In practice you need both: monitoring shows the deviation, and a defined response corrects it.
The standard asks you to retain documented information as evidence of monitoring and measurement results. It also requires evidence of nonconformities, the actions taken and the results of corrective action. Check the exact wording in the current standard and with your certification body.
Yes. HACCP is legally prescribed for food businesses in Slovenia, and it requires monitoring at each critical control point with corrective action when a critical limit is exceeded. Records of monitoring and corrective actions are part of the HACCP documentation.


 069 763 552