


TL;DR:
- Benchmarking production lines reveals hidden losses and quantifies the true performance gap using sensor data.
- Applying continuous, data-driven benchmarking enables plants to recover significant capacity and improve operational efficiency.
Benchmarking production lines is the process of comparing directly measured performance data against internal targets or peer operations to uncover hidden inefficiencies and guide improvement. The industry term for this practice is OEE benchmarking, where OEE stands for Overall Equipment Effectiveness. Most plants believe their lines run well. The reality, confirmed by 2026 data from TeepTrak, is that direct-sensor OEE averages 13.4 points lower than self-reported figures. That gap represents real lost capacity, real lost revenue, and real missed improvement opportunities. Understanding why benchmark production lines matters starts with accepting that manual reporting cannot see what sensors can.
Self-reported OEE is not a reliable baseline. Operators log what they notice. Sensors log everything. The difference between those two data sets is where your actual losses live.
Three categories of hidden loss appear consistently across benchmarking projects:
Profi tipp: Never use self-reported OEE as your benchmarking baseline. Direct sensor coverage above 80% is the minimum standard for data you can trust.
The 13.4-point gap between sensor data and manual reports is not a rounding error. It represents the difference between a plant that thinks it runs at 74% OEE and one that actually runs at 60.6%. Those are two completely different improvement conversations.
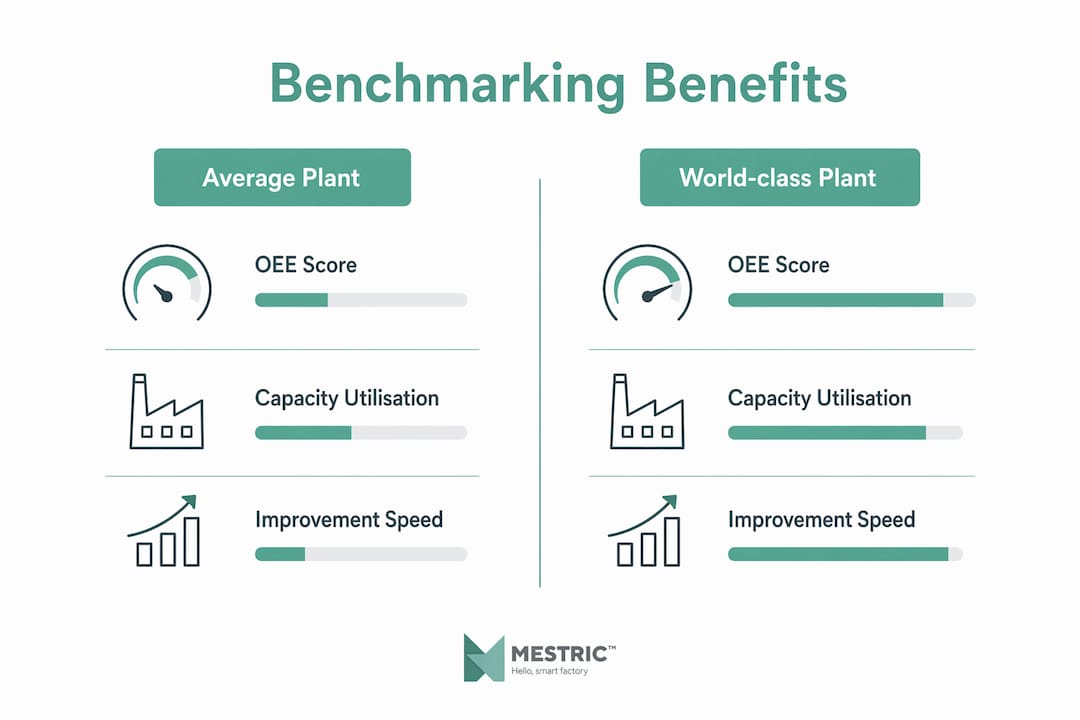
The financial case for benchmarking manufacturing processes is direct and quantifiable. Typical packaging operations run at approximately 60% OEE while world-class peers achieve 85%. Closing that gap recovers 15–25% of capacity without a single capital investment. For a five-line FMCG plant, that translates to an annual revenue gap of $1.5M–$4M attributable to unmeasured, recoverable losses.
| Metric | Average plant | World-class plant |
|---|---|---|
| OEE score | ~60% | ~85% |
| Capacity utilisation | Low | High |
| Hidden capacity gap | 15–25% | Baseline |
| Annual revenue impact (5-line FMCG) | $1.5M–$4M lost | Recovered |
The speed of improvement is equally compelling. Plants adopting real-time OEE benchmarking gain 6–12 OEE points within 12 months, with measurable gains visible as early as 30 days. That pace is only possible because benchmarking tells you exactly where to act, rather than requiring months of investigation.
Profi tipp: Calculate your hidden capacity gap before requesting capital expenditure approval. Benchmarking data frequently shows that existing equipment, run at world-class OEE, can meet demand without new machinery.
Beyond capacity, benchmarking delivers three further operational benefits. First, quality control improves because benchmarking surfaces the specific shifts, lines, and products generating the most defects. Second, benchmarking supports prioritising actions that reduce quality and safety risks by providing context that complaint tracking alone cannot supply. Third, scheduling becomes more accurate when planners work from real throughput rates rather than theoretical cycle times. Each of these benefits compounds. Better scheduling reduces overtime. Better quality control reduces rework costs. Better capacity visibility reduces unnecessary capital spend.
Accurate benchmarking requires three things: high-quality data, consistent definitions, and the right metric. Most projects fail on at least one of these.

On data quality, TeepTrak recommends a minimum of 90 days of continuous data with sensor coverage above 80% of production time. Anything less produces results that reflect noise rather than genuine performance patterns. Short data windows capture unusual weeks. Gaps in sensor coverage allow micro-stops to disappear.
On definitions, the risks are specific:
On metric selection, the choice between OEE, TEEP, and OOE is not interchangeable. OEE, TEEP, and OOE each serve different purposes: OEE measures operational efficiency during scheduled production time, TEEP measures total effective equipment performance including all calendar time, and OOE measures overall equipment output. Selecting the wrong metric before benchmarking produces conclusions that drive the wrong investment decisions.
Profi tipp: Agree on metric definitions across all sites before collecting a single data point. Retrofitting definitions to existing data is unreliable and often invalidates the entire dataset.
Peer comparison also matters. Benchmarking against matched peers by sector and product mix produces valid conclusions. Comparing a high-mix, short-run operation against a single-SKU continuous line produces misleading results that lead to misguided targets.
Benchmarking data is most valuable when it drives targeted action, not league tables. The true value of benchmarking lies in validated insights on peer best practices and prioritising high-return improvements, not in ranking sites against each other.
A structured approach to acting on benchmarking results looks like this:
The lépésről lépésre történő termelésoptimalizálás process works precisely because benchmarking gives each step a measurable starting point. Without that baseline, improvement initiatives are directionally uncertain. With it, every action has a clear expected outcome and a way to verify whether it delivered.
Benchmarking production lines is the most reliable method for identifying hidden losses, quantifying the financial impact of inefficiency, and prioritising the improvements with the highest return.
| Pont | Részletek |
|---|---|
| Sensor data beats self-reporting | Direct-sensor OEE averages 13.4 points lower than manual reports, revealing true performance. |
| Hidden losses are significant | Micro-stoppages alone account for 18–38% of total production loss minutes in most plants. |
| Financial impact is measurable | A five-line FMCG plant can recover $1.5M–$4M annually by closing the OEE gap to world-class. |
| Data quality is non-negotiable | Valid benchmarking requires 90 days of continuous data and sensor coverage above 80%. |
| Metric choice determines conclusions | Selecting OEE, TEEP, or OOE incorrectly leads to flawed investment decisions. |
The most common mistake I see is plants treating benchmarking as a one-off audit rather than a continuous discipline. A team runs the analysis, presents the findings, and then returns to managing by gut feel within a quarter. The OEE gap closes slightly, then drifts back. The benchmarking exercise becomes a line item in a report rather than a change in how the plant operates.
The second mistake is cultural. When benchmarking data shows that a line is running at 58% OEE while a comparable peer runs at 79%, the instinct is to question the data. I have sat in rooms where experienced plant managers spent 45 minutes arguing that the sensor must be wrong. Sometimes the sensor is wrong. More often, the data is correct and the discomfort is real. The plants that improve fastest are the ones that accept the number and ask what to do about it.
What actually works is giving frontline teams direct access to benchmarking data, not just the summary slide. When an operator can see that their shift generates three times the micro-stops of the previous shift on the same line, they act on it. They do not need a management presentation. They need the number and the authority to fix it.
The future of benchmarking is moving towards continuous, automated comparison rather than periodic projects. Manufacturing execution systems that connect directly to equipment make this possible. The plants investing in that infrastructure now will have a compounding advantage over those still relying on weekly spreadsheet reviews in 2027 and beyond.
— Andraž
Mestric connects directly to your manufacturing equipment and delivers the real-time OEE data that accurate benchmarking requires. The platform captures availability, performance, and quality metrics at the machine level, eliminating the manual logging gaps that inflate self-reported figures.

With Mestric, production managers can track manufacturing performance metrics continuously, identify micro-stoppages as they occur, and compare line performance against internal targets. The AI-powered analytics highlight where your largest gaps sit and which corrective actions will deliver the fastest return. If you are ready to move from periodic audits to continuous benchmarking, Mestric’s MES platform gives you the data infrastructure to make it permanent.
OEE benchmarking is the process of comparing a production line’s Overall Equipment Effectiveness score against internal targets or peer operations using directly measured data. It identifies hidden losses in availability, performance, and quality that self-reported figures typically miss.
Manual logging misses micro-stoppages under 5 minutes and speed losses below 10% of ideal cycle time. Direct-sensor measurement averages 13.4 OEE points lower than self-reported data, revealing the true performance gap.
A minimum of 90 days of continuous data with sensor coverage above 80% is required for valid benchmarking conclusions. Shorter windows capture atypical periods and produce unreliable baselines.
OEE measures efficiency during scheduled production time, TEEP measures performance across all calendar time including unscheduled hours, and OOE measures overall equipment output. Selecting the wrong metric leads to flawed investment decisions.
Plants that act on benchmarking data with real-time monitoring typically gain 6–12 OEE points within 12 months, with measurable improvements visible within 30 days of targeted intervention.


 069 763 552