


TL;DR:
- Productivity analytics in manufacturing involves collecting and analyzing data to enhance operational efficiency. Successful implementation depends on reliable data sources, focused metrics, and phased adoption over approximately ten weeks. Leadership engagement and accurate targeting are essential for sustained improvements.
Productivity analytics is the systematic process of collecting, analysing, and acting on manufacturing data to improve operational efficiency and performance measurement. The industry term for this practice within production environments is workforce and operational analytics, though “productivity analytics” is now the standard working phrase across plant floors and boardrooms alike. Manufacturing teams using integrated productivity analytics report a 22% performance increase and a 15% utilisation improvement through real-time bottleneck identification. Those figures are not theoretical. They come from facilities that followed a structured, step-by-step approach rather than deploying tools and hoping for results. This guide gives you that structure.
Productivity analytics in manufacturing is defined as the continuous cycle of capturing machine and workforce data, interpreting it against clear performance targets, and acting on the findings to remove waste. The process breaks into four phases: preparation, data collection, analysis, and sustained improvement. Each phase builds on the previous one, which is why skipping the preparation stage is the single most common reason implementations fail.

The distinction between activity and performance sits at the heart of every effective analytics programme. Many manufacturers measure hours worked rather than output-related productivity, missing the operational insights that actually drive decisions. Tracking hours tells you people are present. Tracking output per machine cycle, yield rates, and downtime duration tells you whether your facility is performing.
Analytics in manufacturing connects these two worlds by linking workforce behaviour data to machine performance data. The result is a single view of where time and capacity are being lost, and why.
The right data sources determine whether your analytics programme produces reliable signals or misleading noise. Three categories of data are non-negotiable: HRIS records (shift patterns, headcount, absenteeism), IoT machine data (cycle times, downtime events, throughput rates), and performance management records (quality defect logs, output targets). Without all three, your analysis will have blind spots.
Before connecting any data source, define exactly three core questions you want the analytics to answer. Focusing on just three key decision-support questions prevents the most common failure mode: tracking too many metrics and drawing no useful conclusions. Typical manufacturing questions include: Where are our primary bottlenecks? Which shifts show the lowest utilisation? What is our defect rate by product line?
The table below outlines the essential tools and data sources for a manufacturing analytics setup.
| Category | Tool or data source | What it provides |
|---|---|---|
| Workforce data | HRIS platform | Shift patterns, absenteeism, headcount |
| Machine data | IoT sensors or MES | Cycle times, downtime, throughput |
| Quality data | Defect logging system | Yield rates, scrap volumes, rework counts |
| Integration layer | Data pipeline or MES | Unified data feed across all sources |
| Visualisation | Dashboard or BI tool | Real-time KPI display for managers |
Technology infrastructure matters as much as the data itself. Data integration failures are the most common barrier to success in manufacturing analytics projects. Prioritising reliable connections between two core data sources before expanding to a third mitigates that risk significantly.
Profi tipp: Start with your IoT machine data and your HRIS as your first two connected sources. Get the integration stable and validated before adding quality or ERP data. A clean two-source feed beats a noisy five-source feed every time.
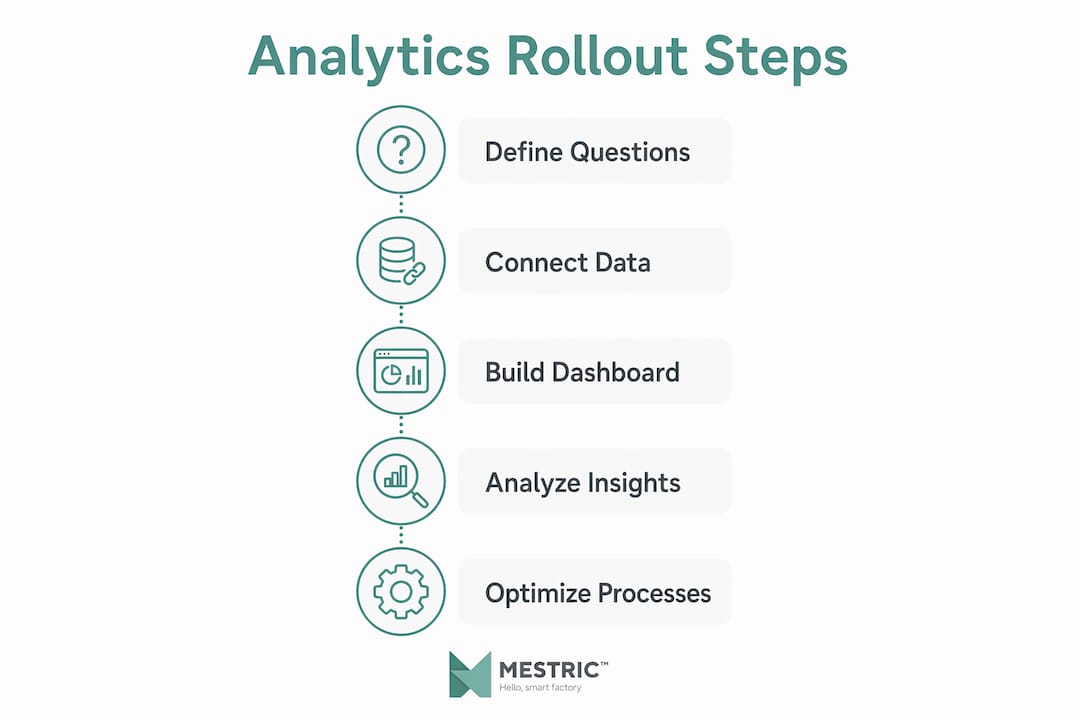
A 30-day rollout plan gives your team a clear, manageable path from zero to a functioning analytics dashboard. The structure below is based on a proven workforce analytics implementation timeline used across manufacturing environments.
The difference between activity measurement and performance measurement becomes visible during Week 4. Tracking activity versus output is a fundamental distinction: a machine logging high run-hours but low throughput is an activity metric masquerading as a performance metric. Your analysis must separate the two.
One factor that consistently distorts early analytics readings is the interruption tax. Untracked machine adjustments and coordination meetings can add 20–30% non-productive time to a shift, skewing your utilisation figures if left unaccounted. Build a category for unscheduled interruptions into your data collection from Day 1.
Profi tipp: Combine your machine behavioural data with a short weekly sentiment survey for shift supervisors. Pairing behavioural and sentiment data gives you a more complete picture of workforce performance and flags morale issues before they affect output.
Sustainable improvement requires phased adoption, not a single large rollout. New productivity tracking routines take a median of 66 days to become ingrained as habits. That figure means a team-by-team rollout over approximately ten weeks is more likely to stick than a facility-wide launch in a single week.
The following practices separate manufacturing teams that sustain their analytics gains from those that see early improvements plateau:
The lépésről lépésre történő termelésoptimalizálás approach works best when analytics outputs feed directly into coaching conversations. When a supervisor can show a machine operator a specific cycle-time trend, the feedback becomes concrete and credible rather than vague.
Data integration failures are the first obstacle most manufacturing teams encounter. The fix is straightforward: validate each data connection individually before combining sources. Run a 48-hour test on each feed, compare the output against your manual records, and only proceed when the two match within an acceptable margin.
Resistance to change is the second obstacle, and it is often underestimated. Production teams that have worked with manual reporting for years will question whether the new system reflects reality. Address this directly by involving shift supervisors in the dashboard design process. When supervisors help choose the metrics displayed, they are far more likely to trust and use the output.
Paralysis by analysis is the third obstacle. Tracking too many metrics without a clear decision framework produces reports that nobody acts on. Return to your three core questions whenever the scope of your analytics programme starts to expand beyond what your team can realistically review and act on each week.
Inaccurate productivity signals caused by the interruption tax require a specific fix. Analytics must explicitly quantify the impact of interruptions such as unscheduled work orders or coordination meetings. Create a discrete interruption category in your data model and require supervisors to log interruption events in real time, not retrospectively.
Profi tipp: Run a two-week pilot on a single production line before scaling your analytics programme to the full facility. A pilot surfaces integration errors, data gaps, and supervisor concerns at a scale that is easy to manage. Fixing problems on one line costs a fraction of fixing them across ten.
Realistic utilisation targets matter for accurate performance measurement. Targeting 70–75% machine utilisation, rather than 100%, accounts for planned maintenance, shift changeovers, and minor adjustments. Teams that target 100% consistently misread their own performance data because the model has no room for legitimate non-production time.
Productivity analytics in manufacturing delivers measurable gains only when built on clean data integration, three focused decision questions, and a phased adoption plan that gives teams time to form new habits.
| Pont | Részletek |
|---|---|
| Define three core questions | Focus your entire analytics programme on three specific operational questions before collecting any data. |
| Validate data connections first | Test each data source individually for 48 hours before combining feeds to avoid integration failures. |
| Account for the interruption tax | Log unscheduled interruptions in real time to prevent 20–30% non-productive time from skewing your figures. |
| Target 70–75% utilisation | Realistic targets give your performance model room for maintenance and changeovers, producing accurate readings. |
| Phase adoption over 66 days | Roll out analytics team by team over approximately ten weeks to build habits that sustain long-term gains. |
The gap between deploying an analytics tool and actually changing how a facility operates is wider than most production managers expect. I have seen teams build excellent dashboards that nobody opens after the first month. The reason is almost always the same: the metrics on screen do not connect to a decision anyone is responsible for making.
The three-question framework is not a simplification. It is a discipline. When you force a production team to agree on exactly three questions before touching any data, you are forcing them to agree on what decisions they actually need to make. That conversation is more valuable than any dashboard.
I am also sceptical of the pace at which AI tools are being pushed into manufacturing analytics. The 2% transformative value figure from Gartner does not surprise me. AI pattern detection is genuinely useful for flagging anomalies in large datasets. But the moment a team starts acting on AI recommendations without validating them against physical machine behaviour, they are flying blind with extra steps.
The facilities that sustain their analytics gains share one trait: leadership engagement. When a plant manager reviews the weekly dashboard in the same meeting where production targets are set, analytics becomes part of the operating rhythm rather than a separate reporting exercise. That integration is what turns a 30-day rollout into a permanent capability.
— Andraž
Mestric connects directly with your manufacturing equipment to deliver real-time performance tracking across every KPI covered in this guide, from machine utilisation and downtime to quality defect rates and cost analysis. The platform is built for production managers who need a clear view of operations without building a custom data pipeline from scratch.

If you are ready to move from manual reporting to a live analytics environment, Mestric’s Manufacturing Execution System gives you the data integration, dashboard visualisation, and AI-assisted bottleneck detection described in this guide. You can also review the MES kontra hagyományos gyártás comparison to understand exactly where a connected MES delivers measurable efficiency gains over conventional methods. Request an onsite demonstration to see how Mestric performs with your specific equipment and production setup.
Productivity analytics is the process of collecting machine, workforce, and quality data, then analysing it to identify inefficiencies and improve operational performance. In manufacturing, it typically covers utilisation rates, downtime events, throughput, and defect rates.
A structured 30-day rollout covers question definition, data connection, dashboard build, and first analysis cycle. Sustainable habit formation takes a median of 66 days, so plan for a phased team-by-team adoption over approximately ten weeks.
Start with machine utilisation rate, downtime frequency and duration, and output yield rate. These three metrics answer the most common operational questions and provide a reliable baseline before expanding your analytics scope.
The most common causes are data integration failures, tracking too many metrics without clear decision questions, and failing to account for the interruption tax. Focusing on two validated data sources and three core questions prevents the majority of these failures.
A target of 70–75% machine utilisation is realistic for most manufacturing environments. Targeting 100% leaves no room for planned maintenance or shift changeovers, which causes performance models to misread legitimate non-production time as inefficiency.


 069 763 552