


First pass yield is the share of units that clear a production step correctly the first time, with no rework and no scrap. Track it at the step level, and you find capacity you already paid for but never see on a standard scrap report. The immediate action for any manufacturing or quality manager: measure FPY at each critical step, then multiply those figures into rolled throughput yield to see what the line actually delivers end to end.
TL;DR:
- Most plants underestimate their losses because they do not consistently log rework, which inflates FPY and hides true process inefficiencies.
- Calculating FPY involves excluding reworked units, meaning a second-pass unit counts as a failure on the first attempt, reducing the true yield.
- FPY at individual steps can be high, but multiplying multiple steps into RTY often reveals a much larger capacity loss end-to-end.
- Automated measurement systems and real-time dashboards significantly improve FPY tracking accuracy and help identify specific process drifts early.
- Targeting over 99% FPY per step is ideal, but understanding process complexity and maintaining strict acceptance criteria are key to realistic, sustainable improvements.
FPY strictly excludes anything that needed a second attempt. The formula is straightforward:
FPY = (units entering the step, minus scrap, minus rework) ÷ units entering the step
A unit that gets fixed and passes on the second try still counts as a first-pass failure, because it never completed the step correctly the first time. This is the detail most teams get wrong, and it inflates their numbers without anyone noticing. The Wikipedia entry on first-pass yield sets out the counting rule clearly: rework is excluded from the numerator, full stop.
Here’s a worked example from a solder paste inspection step:
Those 30 reworked boards still ship, and they still count as revenue. But they consumed labour, machine time, and inspection capacity twice. That’s the cost FPY makes visible and a scrap-rate report hides.
Before you calculate anything, agree what “pass” means. A cosmetic blemish that fails one inspector’s eye but passes another’s will corrupt your data long before any process problem does.
FPY tells you about one step. Rolled throughput yield (RTY) tells you what happens when you chain several steps together, and the difference between the two numbers is usually where the real story sits.
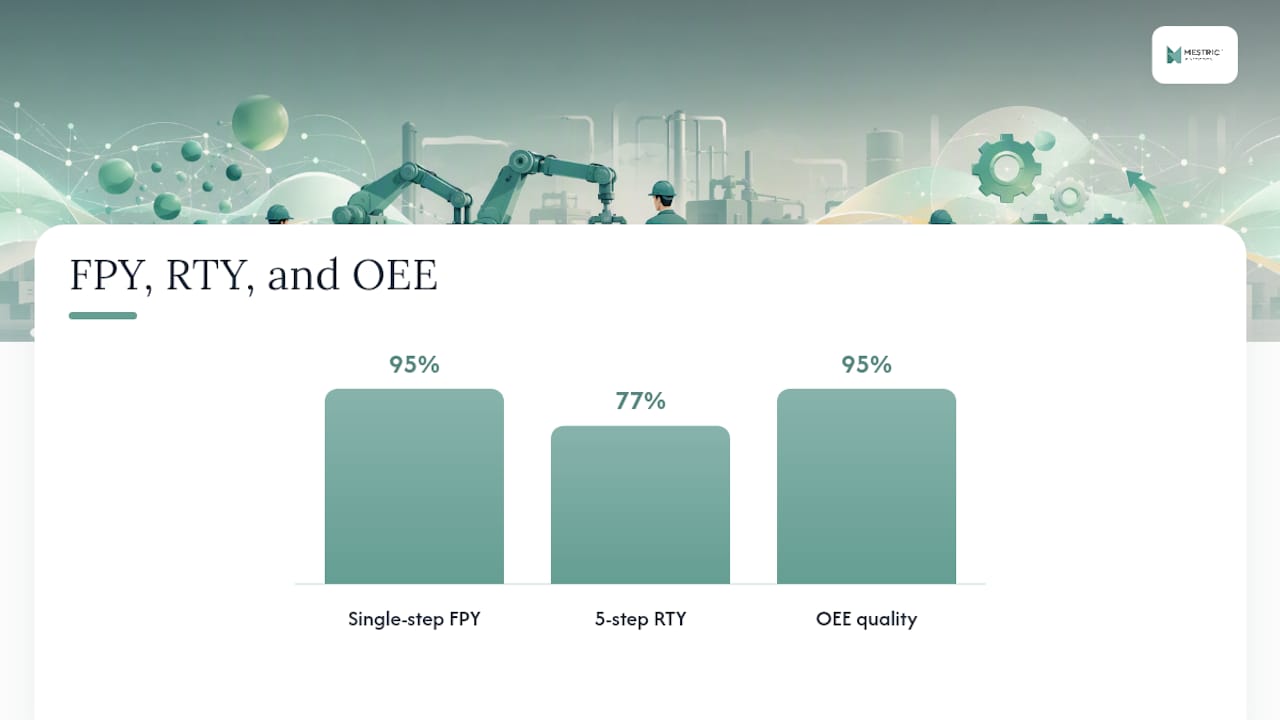
RTY multiplies the FPY of every step in sequence: RTY = FPY₁ × FPY₂ × FPY₃ × … × FPYₙ. A line with five steps, each running a respectable 95% FPY, delivers an RTY of just 77%. That gap between “95% looks fine” and “77% is what customers actually get first time” is what practitioners call the hidden factory: capacity spent entirely on redoing work nobody budgeted for.
A few points worth holding onto when you compare the two metrics:
If you only ever report FPY per station, you will miss where rework actually accumulates. Calculate both, and report them side by side.
Measurement fidelity is where most FPY programmes quietly fail. The formula is simple; the data collection behind it rarely is.
Pro Tip: *Run a one-week parallel check where a supervisor manually counts units alongside your automated system.
Low FPY rarely has one cause. It usually has three or four, and the trick is working out which one is costing you the most units, not which one looks the most dramatic on a chart.
Diagnose by absolute rework volume, not just percentage drop. Fix the first one first, even though its percentage looks healthier.
The strongest FPY gains come from combining technical controls with disciplined people management. Neither works well alone.
Pro Tip: When you pilot an intervention, run it on one high-volume station for two to four weeks and compare FPY and RTY before and after, rather than rolling changes across the whole line at once. You isolate the effect, and you avoid disrupting stations that were already performing well.
Manual tallies work for a pilot. They fall apart the moment you try to sustain gains across multiple lines and shifts, because someone eventually stops logging the rework bench, and your numbers quietly drift from reality.
A platform like Mestric captures units in and out at each step automatically, flags rework the moment it happens, and puts FPY on a live dashboard rather than a weekly spreadsheet.
World-class per-step FPY generally sits at or above 99%, though the realistic target for your line depends heavily on process complexity. A multi-step SMT process with dozens of components has more places for a defect to enter, so the honest target for each individual step matters more than any single blended number.
Watch for metric gaming: a step “improves” when its boundary quietly shifts to exclude a rework loop, or when acceptance criteria loosen. Neither is a real gain, and both will show up as a mismatch against final shipped yield.
Every point of FPY recovered on a high-volume step returns capacity without new capital. That’s the business case, stated plainly, and it’s why the metric deserves more attention than a monthly scrap report gives it.
Most plants I’ve reviewed find their real losses one or two stations deeper than where they were looking. The hidden factory is rarely hidden by much, just by whoever stopped logging the rework bench. Real-time monitoring closes that gap fast. Pilot one station, measure FPY and RTY before and after, and the case usually makes itself.
— Andraž
Chasing FPY with spreadsheets and shift-end tallies means you’re always reacting to last week’s problem. Mestric connects directly to your equipment and captures units in, units passing first time, and rework flags automatically, so nothing gets lost in a handover.

Start with a pilot on one high-volume step, the same approach that drove the SMT FPY gains covered earlier, and compare your before-and-after numbers on a live dashboard rather than a monthly report. You’ll see where rework is actually accumulating within days, not weeks. If you’re ready to see how automated FPY capture works on your own line, request a Mestric demonstration and bring your current scrap and rework figures to the call.


 069 763 552