


Kurzfassung:
- Factory workflow mapping visually documents every manufacturing step, role, and material flow to reveal inefficiencies. It helps create a digital twin of operations, enabling proactive, data-driven improvements. Continuous, real-time mapping enhances factory efficiency, quality, and resource utilization.
Factory workflow mapping is defined as the visual documentation of every step, role, and material flow within a manufacturing process, from raw input to finished output. Known formally as process mapping or value stream mapping in industry standards, it gives production managers a clear picture of how work actually moves through a factory, not how they assume it does. When applied correctly, workflow mapping shifts manufacturing management from reactive firefighting to proactive, data-driven improvement. For manufacturing professionals working towards operational excellence in 2026, understanding this discipline is the starting point for every meaningful efficiency gain.
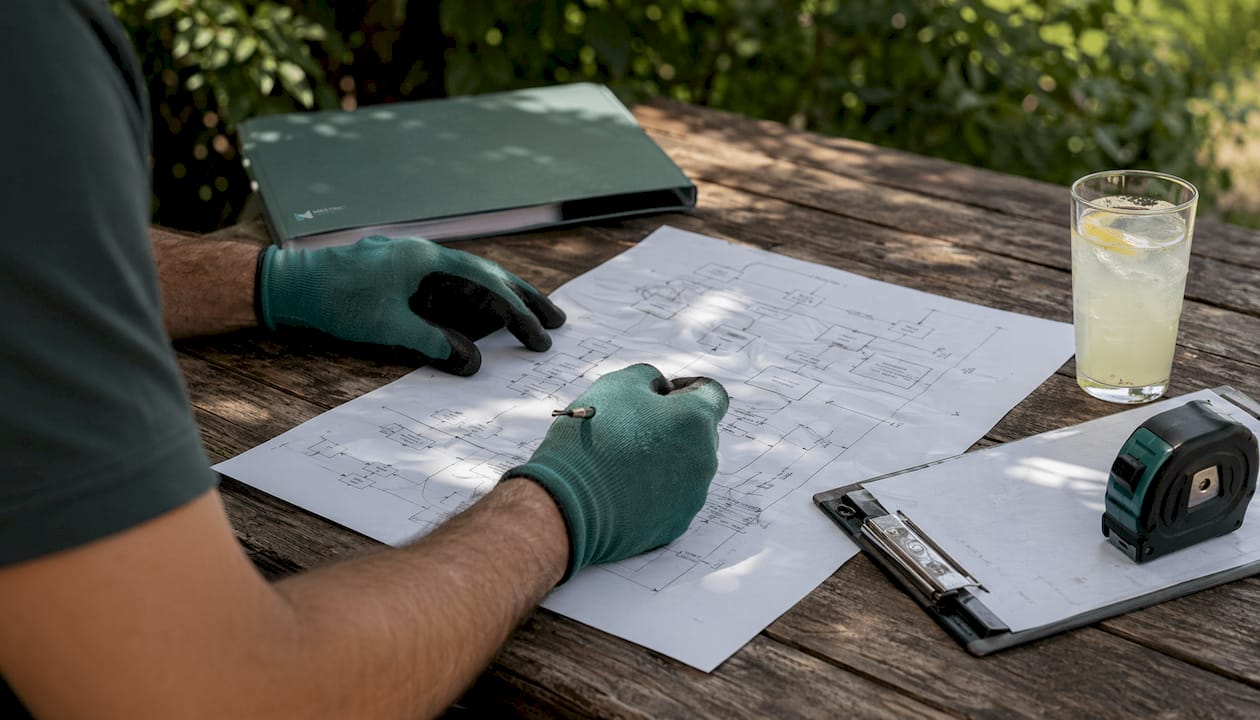
Factory workflow mapping is the practice of creating a structured, visual record of your manufacturing processes. Each map captures process steps, decision points, material movements, waiting times, and the people or machines responsible at each stage. The result is a single source of truth that makes hidden inefficiencies visible to everyone from the shop floor to the boardroom.
The discipline matters because most production problems are invisible until they cause a crisis. A machine sits idle for 20 minutes between shifts, a quality check duplicates work already done upstream, or a handover between departments creates a consistent delay. None of these appear on a production schedule. Workflow maps surface them before they compound into larger losses.
Workflow analysis in manufacturing also creates the foundation for digital systems to function correctly. Workflow maps act as the digital twin of your manufacturing logic, and without verified process documentation, MES and ERP platforms cannot align with actual operations. The map is not just a planning tool. It is the backbone of your digital infrastructure.
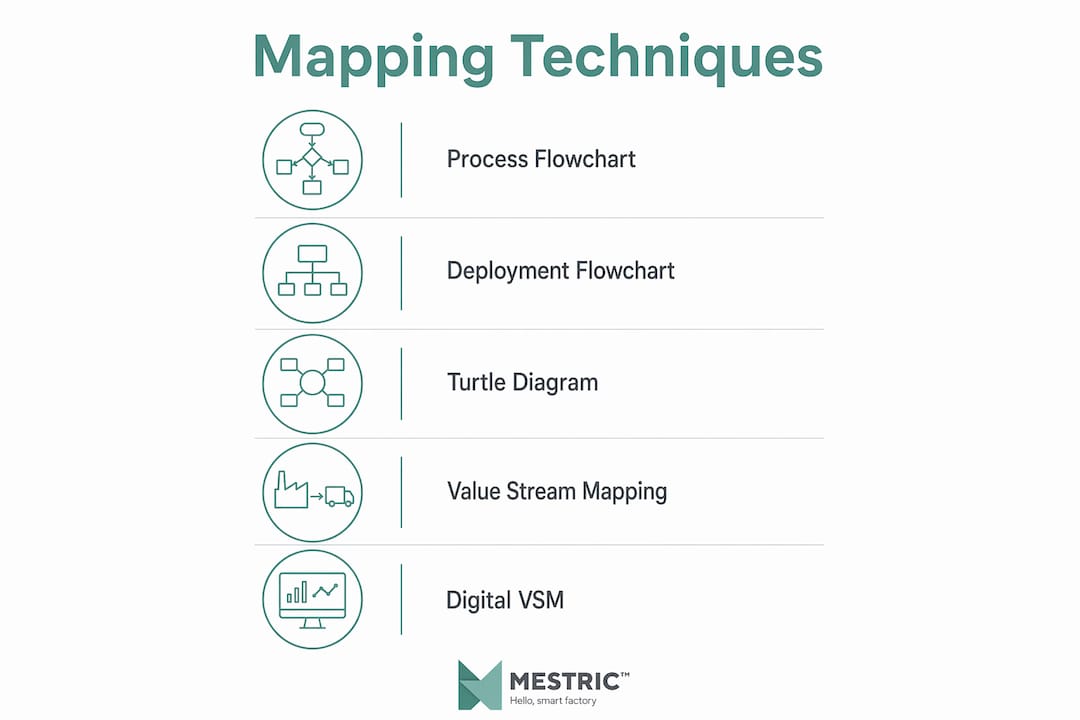
Four mapping techniques dominate manufacturing practice, and each serves a different purpose.
Process flowcharts are the most familiar format. They use standardised symbols to show the sequence of operations, decisions, and outputs in a single process. Use them when you need a quick overview of a linear production line or want to onboard new team members to a specific workflow.
Deployment flowcharts, sometimes called swim-lane diagrams, map tasks across departments or roles in parallel lanes. This method assigns specific jobs and shows cross-functional task flows, making it the right choice when miscommunication between teams is causing delays or quality failures.
Turtle diagrams take a single process and document it in full operational context. They capture inputs, outputs, resources, controls, and the person accountable for each element. Turtle diagrams facilitate risk assessment and auditing through transparent process ownership, making them particularly useful for ISO 9001 compliance work.
Value Stream Mapping (VSM) is the most powerful technique for identifying waste across an entire production flow. It maps both material and information flows, quantifies cycle times and waiting times, and distinguishes value-added steps from non-value-added ones. VSM is the standard tool for Lean manufacturing programmes.
The most advanced form is Digital Value Stream Mapping. Integration of production sensors, AI algorithms, and simulation validation enables dynamic workflow mapping that updates in real time as conditions change on the shop floor.
Pro-Tipp: Choose your mapping technique based on the question you are trying to answer. If the question is “who does what and when?” use a deployment flowchart. If the question is “where is time being lost across the whole line?” use value stream mapping.
| Technique | Am besten für | Key output |
|---|---|---|
| Process flowchart | Single process overview | Step-by-step sequence diagram |
| Deployment flowchart | Cross-department clarity | Role and task assignment map |
| Turtle diagram | ISO auditing and accountability | Process ownership record |
| Value stream mapping | Waste and flow analysis | End-to-end time and material map |
Mapping increases visibility across processes, creating a foundation for continuous improvement that no amount of gut instinct can replicate. When you can see cycle times, waiting times, and handover points laid out together, the bottlenecks become obvious. A station with a cycle time of 90 seconds feeding into one with a cycle time of 45 seconds will always create a queue. The map tells you exactly where to focus.
The real power comes when you integrate live data from PLCs, MES platforms, and ERP systems into your maps. Static diagrams show you how a process was designed. Live data shows you how it actually performs today. The gap between those two pictures is where your improvement opportunities live.
Workflow mapping also quantifies waste in terms that finance teams understand. When a map shows that 18% of a process step’s time is non-value-added waiting, that translates directly into labour cost, machine occupancy loss, and throughput reduction. You can identify production bottlenecks with precision and build a business case for change with real numbers rather than estimates.
Key efficiency gains manufacturing teams regularly achieve through workflow mapping include:
For manufacturers working towards sustainable manufacturing practices, workflow mapping also reveals where energy and material waste occur, supporting both cost reduction and environmental targets simultaneously.
Creating an accurate factory workflow map follows a clear sequence. Skipping steps produces maps that look complete but fail to reflect reality, which is worse than having no map at all.
Traditional mapping methods using Post-It notes and whiteboards have given way to advanced planning and scheduling software that supports inventory, capacity, and order management integration. Digital tools also make collaboration easier, because multiple team members can review and annotate maps without being in the same room.
Pro-Tipp: The most common mapping mistake is building the map in a meeting room without walking the actual production floor. Always validate your map against observed reality before using it to make decisions.
Digital transformation in manufacturing does not start with software. It starts with knowing exactly how your processes work. Workflow mapping is the prerequisite for every Industry 4.0 initiative, because you cannot digitise a process you have not yet understood.
Digital Value Stream Mapping takes traditional VSM and connects it to live production data. Sensors on machines feed real-time cycle times and downtime events directly into the map. AI algorithms analyse patterns across the data to flag emerging bottlenecks before they affect throughput. The map becomes a living document rather than a snapshot taken once and filed away.
Real-time dashboard visualisations built on accurate workflow maps give production managers the ability to make decisions based on current conditions rather than yesterday’s shift report. When a machine’s cycle time drifts upward, the dashboard flags it immediately. The manager can act before the downstream station runs out of work.
Workflow maps also serve as the digital twin of your shop floor logic. MES and ERP systems depend on accurate process documentation to schedule correctly, allocate resources, and report performance. A map that does not reflect reality produces system outputs that no one trusts, which leads teams to revert to spreadsheets and manual workarounds.
| Aspect | Traditional mapping | Digital workflow mapping |
|---|---|---|
| Data source | Manual observation and timing | Live PLC, MES, and ERP feeds |
| Update frequency | Periodic, project-driven | Continuous, real-time |
| Bottleneck detection | Retrospective analysis | Predictive, AI-assisted alerts |
| Collaboration | Physical documents and meetings | Shared digital platforms |
| Integration | Standalone diagrams | Connected to simulation and scheduling tools |
Manufacturers who improve manufacturing efficiency through digital mapping gain a closed-loop system: map, monitor, simulate, adjust, and repeat. That cycle is the operational engine of continuous improvement in 2026.
Factory workflow mapping is the single most effective tool for making manufacturing inefficiencies visible, quantifiable, and fixable before they become costly.
| Punkt | Details |
|---|---|
| Start with the right technique | Match your mapping method to your goal: VSM for waste, deployment flowcharts for cross-team clarity, turtle diagrams for accountability. |
| Map reality, not intention | Always validate your map against observed floor conditions, not engineering design documents. |
| Assign clear ownership | Every process step needs a named role accountable for its performance and improvement. |
| Integrate live data | Connect maps to PLC, MES, and ERP feeds to move from static snapshots to real-time operational insight. |
| Simulate before changing | Use discrete-event simulation to test improvements before committing to physical changes on the production line. |
I have reviewed workflow documentation across a range of manufacturing environments, and the pattern is consistent. The factories with the most detailed, beautifully formatted process maps on their quality management system are often the same ones with the most persistent bottlenecks. The maps were accurate when they were drawn. Nobody updated them after the last line reconfiguration.
Static diagrams give you a false sense of control. They tell you how the process was designed, not how it runs today. The moment a machine is relocated, a shift pattern changes, or a new product variant is introduced, the map becomes fiction. Decisions made from that fiction compound into real losses.
What actually works is treating the map as a living system. When I see a production team that reviews its workflow data weekly, adjusts its maps after every significant change, and uses simulation to test ideas before acting on them, that team consistently outperforms its peers on throughput, quality, and cost. The map is not the goal. Accurate, current knowledge of your process is the goal.
The other mistake I see regularly is mapping in isolation. Workflow analysis in manufacturing works best when the people doing the work are in the room. Operators know where the unofficial workarounds are. Engineers know where the design assumptions broke down. Managers know where the scheduling pressures create shortcuts. A map built without all three perspectives will miss something important.
Embrace digital tools, but do not let the technology substitute for the discipline of actually understanding your process. The best MES platform in the world cannot compensate for a workflow map that nobody trusts.
— Andraž
Mestric connects directly to your manufacturing equipment, pulling real-time data on cycle times, downtime, quality parameters, and machine occupancy into a single platform. That live data is exactly what transforms a static workflow map into a production operations tool that reflects current conditions on your shop floor.

Production managers using Mestric can monitor KPIs, detect bottlenecks as they form, and track the impact of process changes without waiting for end-of-shift reports. The platform’s AI-powered analytics layer identifies patterns across your workflow data, giving you the insight to act before small inefficiencies become significant losses. If you are ready to move from paper maps to live operational intelligence, Mestric offers an onsite demonstration that shows exactly how connected machinery benefits your production environment.
Factory workflow mapping is the process of visually documenting every step, role, and material movement in a manufacturing process. It makes the actual flow of production visible so that inefficiencies and bottlenecks can be identified and corrected.
Value stream mapping is the most widely used technique for manufacturing because it captures both material and information flows across an entire production line. For cross-departmental clarity, deployment flowcharts are the more effective choice.
Workflow maps record cycle times and waiting times at each process step, making it straightforward to spot where work queues build up. Mapping increases visibility across processes, enabling teams to quantify waste and act on it with real data.
Accurate workflow documentation is essential for ERP and MES systems to function correctly. Without verified process logic, these systems schedule and report based on assumptions rather than reality, which reduces their reliability and the trust teams place in their outputs.
Workflow maps should be reviewed after every significant change to equipment layout, product mix, shift patterns, or process design. In environments using digital mapping tools connected to live production data, updates happen continuously rather than on a fixed schedule.


 069 763 552