


The 5 Whys analysis is a root cause technique that asks “Why?” repeatedly, usually around five times, until you reach the process failure behind a problem rather than just its symptom. It works best on straightforward, recurring faults where a clear breakdown in procedure is suspected. Done properly, it ends not with a diagnosis but with a specific, measurable countermeasure.
TL;DR:
- The 5 Whys technique is most effective for simple, recurring production faults rather than complex, multi-causal failures that involve multiple processes or shifts.
- A structured 5 Whys session requires a clear problem definition, a multidisciplinary team, verification of each answer, and a concrete countermeasure with assigned ownership and deadlines.
- Asking more than five questions is unnecessary; teams should continue until they identify a systemic, actionable root cause rather than stopping prematurely or blaming individuals.
- Combining 5 Whys with tools like fishbone diagrams or Pareto analysis enhances effectiveness when causes branch or multiple issues compete for attention.
- Integrating the method into continuous improvement practices and linking it to real-time data systems ensures sustainable, measurable progress.
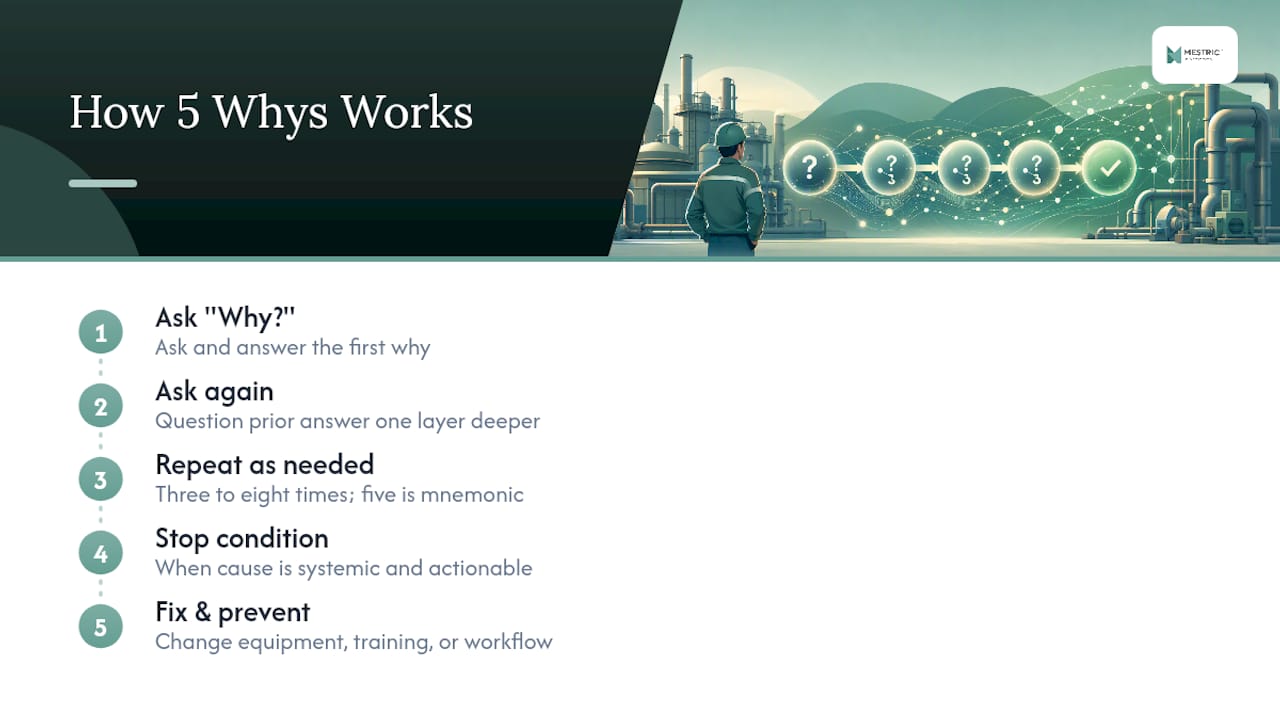
The 5 Whys technique traces back to Sakichi Toyoda, founder of Toyota Industries, and became a core problem-solving habit inside the Toyota Production System. The idea is deceptively simple: ask “Why did this happen?”, answer it, then ask “Why?” again about that answer, moving one layer deeper each time until you land on something you can actually fix.
The name “five” is a mnemonic device, not a rule. Some problems reveal their root cause after three questions; others need seven or eight before you stop hitting excuses and start hitting process. What matters is the destination, not the headcount of questions. You stop when you reach a cause that’s systemic and actionable, something a change in equipment, training, or workflow can genuinely prevent from happening again.
For teams new to structured problem solving, this technique pairs well with a broader look at lean manufacturing principles, since 5 Whys grew directly out of that tradition.
5 Whys earns its keep on everyday production troubles: a machine that keeps jamming, a batch that fails inspection, a delivery that’s late for the third week running. These are usually single-thread problems with one dominant cause chain, and 5 Whys is fast enough to run in fifteen minutes on the shop floor.
It struggles with complex, multi-causal failures. A quality escape that involves three shifts, two suppliers, and a design tolerance issue rarely has one clean chain of “why”. Force that kind of problem through a straight line of questions and you’ll get an oversimplified answer that feels tidy but misses half the picture.
The 5 Whys technique works best for simple to moderately complex issues; for anything with branching causes, pair it with a fishbone diagram, and use Pareto analysis to decide which recurring problem deserves attention first.
A good session isn’t a corridor conversation, it’s a short, disciplined meeting with a clear start and finish. Follow this sequence and you’ll get a defensible result every time.
Two things separate a rigorous session from a guessing exercise:
Pro Tip: Write each “why” and its verification method on a whiteboard as you go. If you can’t name how you’d verify an answer, you’re not ready to accept it as the cause.
The most common failure is treating five as a quota. Teams ask four questions, land on something that sounds like an answer, and stop, even though it’s still describing a symptom rather than a cause. Keep asking until the answer points to something you can change in the process.
The second failure is blaming a person instead of the system. “The operator forgot to check the gauge” isn’t a root cause, it’s a dead end. Reframe it: “What in the process allowed that check to be skipped without anyone noticing?” That question usually leads somewhere useful, like a missing checklist step or a poorly positioned gauge.
A third mistake is running the analysis solo. One person’s assumptions rarely match what actually happened on the floor. Bring in people at different levels, and treat every answer as a hypothesis to test, not a fact to record.
Pro Tip: If your final answer is a person’s name or a one-off mistake, you haven’t finished. Keep asking “why” until the answer is a process, a standard, or a piece of equipment.
Here’s a short 5 Whys analysis following a specific, measurable symptom through to a countermeasure.
Countermeasure: Add a thickness tolerance check to incoming inspection for all film suppliers, owned by the quality lead, in place within two weeks.
Reach for a fishbone diagram when the causes branch rather than follow a single chain, machine, method, material, and people all contributing at once. A fishbone lets the team map several causal threads side by side instead of forcing them into one line of questions. Combining 5 Whys with visual RCA tools works particularly well when a single symptom has multiple plausible origins.
Use Pareto analysis when you’re facing several recurring problems and need to decide which one to tackle first. It won’t find the cause, but it tells you where the effort pays off most.
Before any session, gather:
Capturing time-series metrics before the session lets the team separate correlation from causation instead of guessing from memory.
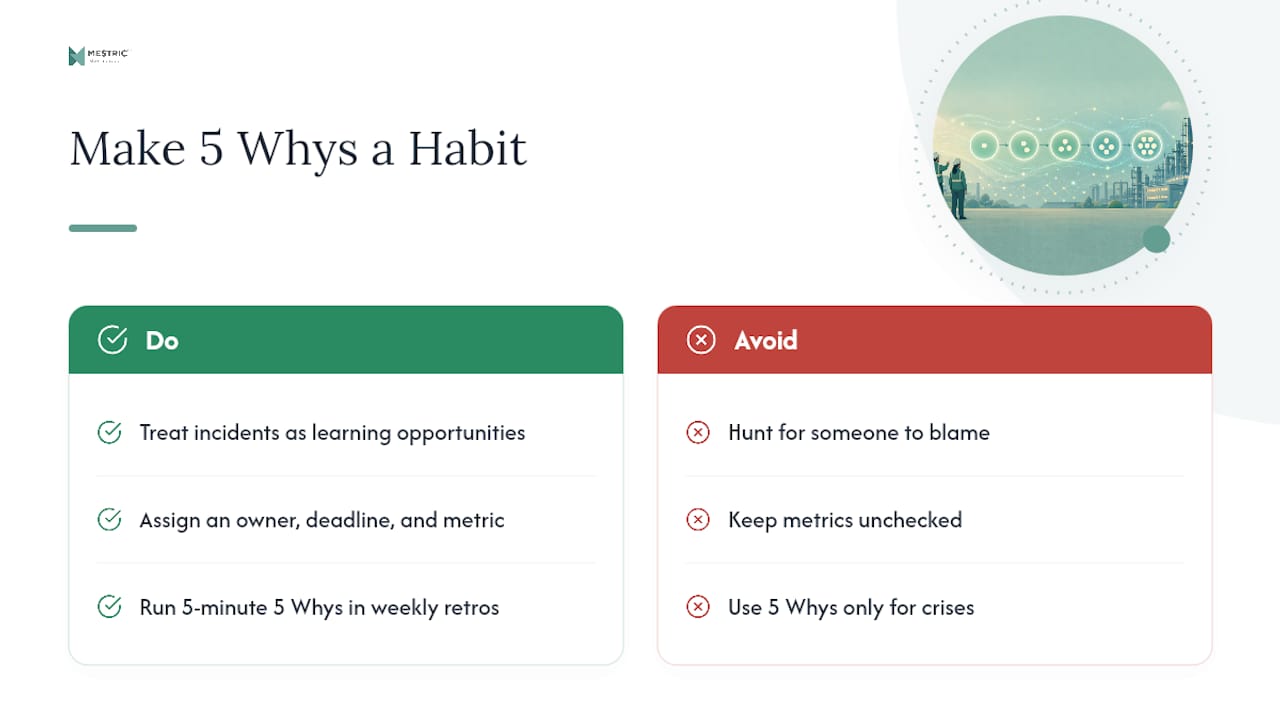
The technique itself is simple. What makes it work over time is culture. Teams that treat an incident as a learning opportunity get honest answers; teams that hunt for someone to blame get defensive silence, and the same fault returns within a month.
Keep governance light but real: every countermeasure needs an owner, a deadline, and a metric someone actually checks. Some of the most consistent improvement comes from plants that run a five-minute 5 Whys as a standing item in weekly retrospectives, turning it from a crisis tool into a habit.
— Andraž
A 5 Whys session is only as strong as the data behind it, and that’s where most paper-based investigations quietly fall apart. Verifying a “why” against a maintenance log or a downtime record is easy to promise in a meeting and hard to do consistently when that data lives in three different spreadsheets.

Mestric connects directly to your equipment, so the downtime logs, quality metrics, and shift-level KPIs your team needs to verify each causal link are already sitting in one place before the session starts. Once you’ve agreed a countermeasure, the same real-time dashboards let you watch the metric you set, whether that’s downtime percentage or defect rate, without waiting for next month’s report to find out if the fix worked. For teams that want to see how this looks against manual tracking, our guide on streamlining production operations walks through the shift in practice. Book a demo to see how your own shop floor data could support your next root cause investigation.


 069 763 552