


TL;DR:
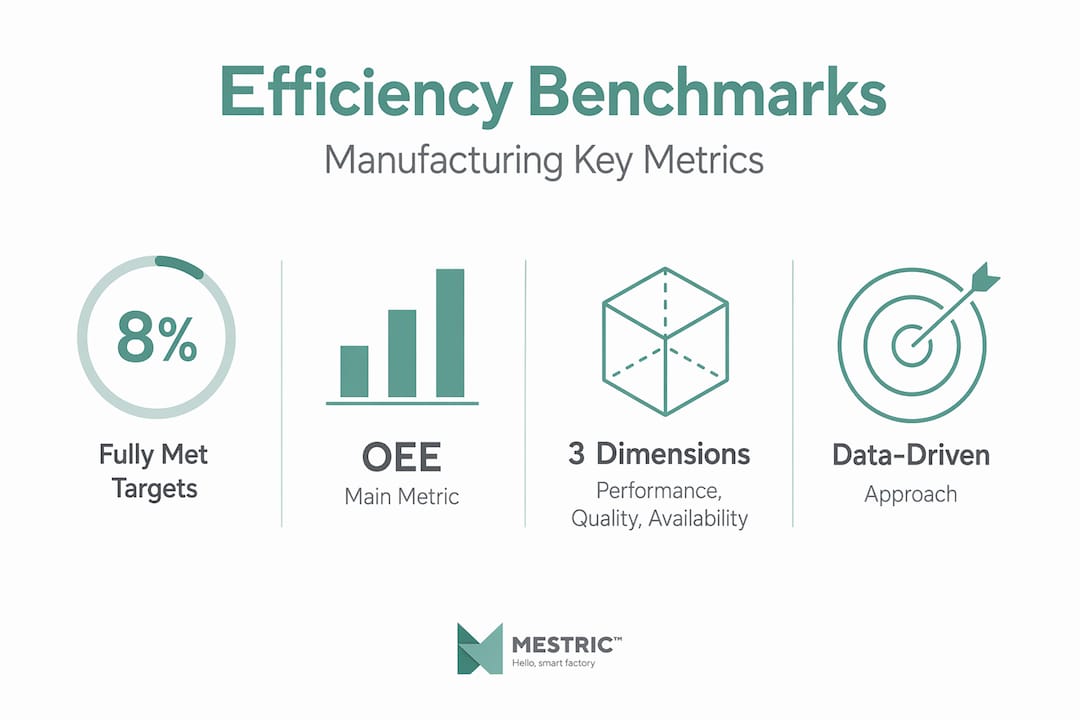
- Most manufacturing success relies on organizational routines and management discipline rather than technology. Only 8% of manufacturers achieve their digital goals because many neglect foundational practices, measurement, and sustained behavior change. Embedding routines, aligning KPIs, and designing change management are essential for long-term operational efficiency improvements.
Most manufacturing executives understand the stakes of digital transformation, yet only 8% of manufacturers achieve all their targeted results from digital initiatives. That gap between ambition and outcome is not caused by a lack of investment or intent. It comes from missing the structural foundations that make efficiency gains measurable and repeatable. This guide walks you through a proven, step-by-step approach to improving operational efficiency, from baseline assessment to sustaining long-term gains, with benchmarks, governance models, and pitfalls clearly mapped at every stage.
| Point | Details |
|---|---|
| Start with assessment | Use a structured audit and metrics like OEE to map your current state and set improvement targets. |
| Anchor in routines | Link every digital tool to daily management routines and clear, actionable KPIs. |
| Prioritise change management | Form internal teams, upskill, and streamline governance to enable and sustain transformation. |
| Track with benchmarks | Use world-class metrics and dashboards to measure, track, and recalibrate improvement programmes. |
| Avoid common pitfalls | Sustain gains by aligning technology, organisational change, and explicit targets throughout your journey. |
Before you can improve anything, you need to know where you stand. This sounds obvious, yet many transformation programmes skip a thorough current-state assessment in favour of jumping directly to technology deployment. That shortcut is costly.
A practical operations transformation approach begins by assessing your current operations system, then designing an implementation roadmap and change management strategy to capture quantified improvement potential. In practice, this means examining four areas: your processes, your digital enablers, your analytics capability, and your management routines. Each one can either amplify or neutralise the others.
Loss visibility is the first measurable output of this assessment. The most widely used tool is OEE, overall equipment effectiveness. OEE combines three factors: availability (what percentage of scheduled time the equipment is running), performance (how fast it is running relative to its maximum), and quality (what proportion of output meets specification). The result is a single percentage score that tells you how much of your production capacity you are actually using productively. Understanding the manufacturing efficiency impact of this score is the starting point for any credible improvement programme.
OEE has limitations. It does not capture energy consumption, human effort, or supply chain variability. However, as a primary baseline metric, it is the most actionable place to start. Use it alongside cycle time, quality rate, and unplanned downtime to build a fuller picture.
Here is a reference table of key baseline metrics, their definitions, and what strong performance looks like:
| Metric | Definition | World-class target |
|---|---|---|
| OEE | Availability × Performance × Quality | 85% or above |
| Cycle time | Time to complete one production unit | Consistent with takt time |
| First-pass yield | % of units meeting spec on first pass | 95% or above |
| Unplanned downtime | Hours lost to unexpected stoppages | Less than 5% of scheduled time |
| Changeover time | Time to switch from one product to another | Benchmarked against industry sector |
Follow this numbered sequence to structure your current-state assessment:
Pro Tip: Partial audits produce partial results. If your data collection covers only a subset of shifts or equipment types, your baseline will be misleading and your improvement targets will be set incorrectly from the start.
Use a process improvement guide to map this assessment against established frameworks and ensure you are not missing critical input areas.
Once you have clarified your improvement potential, embedding new routines and measurement is the next foundation. This is the step most transformation programmes underestimate.
![]()
Digital transformation in manufacturing needs to be coupled with organisational routines and governance. Technology alone is not sufficient without management routines, actionable KPIs, and a pairing of leading and lagging indicators. A dashboard that nobody reviews daily is just a screen. A KPI that nobody owns is just a number.
The distinction between leading and lagging indicators matters enormously here. Lagging indicators, such as monthly defect rates or quarterly OEE scores, tell you what happened. Leading indicators, such as daily preventive maintenance completion rates or operator downtime logging adherence, tell you what is likely to happen. Pairing both within your operational excellence frameworks gives your teams the tools to intervene before problems become visible in the output data.
Here are practical examples of actionable KPIs and the daily routines that should accompany them:
The examples of manufacturing KPIs that drive real results share one characteristic: they are acted on regularly, not archived.
Pro Tip: Automate data capture wherever possible and display results visibly at every relevant level, from the shop floor screen to the leadership dashboard. When teams see their own performance in real time, the data becomes a tool for action rather than a report for management.
“Daily KPI routines transform digital tools from dashboards into discipline.”
Tracking the right KPIs is not just about selection. It is about building the management habits that make those KPIs drive behaviour every single day.
With routines and KPIs defined, the next step is aligning teams, establishing clear sequencing, and putting robust change management in place.
Smart manufacturing adoption requires managing talent, complex transformations, and operational risk. Successful organisations invest in cybersecurity safeguards, workforce upskilling, and form dedicated internal change teams. Each of these elements belongs in your roadmap design from day one, not as an afterthought once technology is live.
Compare the two most common approaches to implementation:
| Element | Technology-led only | Integrated (behaviour and technology) |
|---|---|---|
| Starting point | Select and deploy software | Define business goals, then select tools |
| Change management | Minimal or reactive | Embedded from the outset |
| KPI ownership | IT or management only | Frontline teams and managers |
| Risk of stalling | High | Significantly lower |
| Likelihood of sustained gains | Low | High |
| Cybersecurity and upskilling | Often overlooked | Planned as part of roadmap phases |
Changing behaviours is the primary transformation mechanism, not treating digital initiatives as a business goal in themselves. Governance streamlining, including reducing unnecessary meetings and clarifying decision rights, directly frees leadership capacity for high-impact improvement work.
To build your internal change team, follow these steps:
Pro Tip: Review your meeting frequency and decision rights before deployment. Governance overload is one of the most common reasons leadership time is unavailable for improvement activities. Reducing low-value meetings by even 20% can free significant capacity. Keep an eye on the latest efficiency trends to ensure your roadmap reflects what leading manufacturers are already implementing.
Once implementation begins, robust benchmarking and progress tracking are essential to sustain results.
OEE remains the most widely used single metric for equipment effectiveness because it combines availability, performance, and quality into one score, giving leadership a fast read on how productively assets are being used. However, understanding what the benchmarks actually mean in context is critical to setting credible targets.
| OEE score | Interpretation | Action |
|---|---|---|
| Below 40% | Significant losses present | Prioritise availability and quality losses immediately |
| 40% to 60% | Room for structured improvement | Begin loss analysis and root cause work |
| 60% to 75% | Approaching industry average | Focus on performance and changeover losses |
| 75% to 85% | Good performance | Sustain and look for further incremental gains |
| Above 85% | World-class | Benchmark externally and maintain discipline |
Beyond OEE, strong programmes track a broader set of metrics to get a complete view of operational health:
Despite growing investment in digital tools, only 8% of manufacturers achieve all their digital initiative targets. That figure is not a reason for pessimism. It is a clear signal that measurement alone is not enough. Metrics must be treated as programme objectives connected to strategic goals, not as compliance targets that sit in a report.
Use data-driven efficiency improvement approaches to make your metrics work actively for your programme. Connect practical manufacturing KPIs directly to team-level accountability and review cycles so that the data drives action at every level of the business.
Sustaining efficiency gains means being vigilant against the most common and costly operating model pitfalls.
Transformations are derailed by execution and operating model failures, including missing links between targets and business goals, and separating technology changes from organisational changes. In short, programmes that treat technology and people as separate workstreams consistently underperform against those that integrate them.
The most frequent failure modes in manufacturing improvement programmes are:
To embed habits and sustain gains over the long term, follow this sequence:
Signs your programme is going off-track include:
Use the manufacturing optimisation checklist to audit your programme regularly and address gaps before they become structural. Review process optimisation for leaders to reinforce the disciplines that separate programmes that sustain results from those that plateau.
“Lasting gains come from organisational change, not new technology alone.”
Here is the uncomfortable reality that most technology vendors will not tell you: the digital tools are rarely the limiting factor in manufacturing improvement programmes. The limiting factor is almost always human behaviour, management discipline, and organisational routines.
This is not an opinion without evidence. The 8% success rate on digital initiatives is not explained by poor technology choices. It is explained by programmes that treated technology deployment as the destination rather than the vehicle. When a manufacturer installs a new MES or analytics platform and then waits for efficiency to improve, the wait is almost always indefinite.
What actually drives sustainable gains is what we call the “invisible work.” This includes changing how supervisors run shift handovers, ensuring that operators log downtime causes accurately and immediately, making KPI conversations a daily habit rather than a monthly event, and building enough psychological safety that frontline teams surface problems rather than hide them. None of this appears in a software specification.
AI’s true impact on efficiency is not that it replaces human judgement. It is that it makes the right information available at the right time so that human judgement can be applied faster and more accurately. That only works when the management routines exist to act on the information.
The manufacturers who outperform their peers share one characteristic: they design their improvement programmes around explicit links between business goals, KPIs, management routines, and technology. The technology is chosen to support the process, not to define it. When you approach operational efficiency as a business transformation that happens to use digital tools, the success rate looks very different from the industry average.
The path from assessment to sustained improvement is clearer than most organisations realise. The frameworks, benchmarks, and governance models covered in this guide give you the structural foundations your programme needs.
If you are evaluating the right technology to support your improvement programme, understanding the difference between MES and traditional manufacturing approaches is a practical starting point. For teams focused on day-to-day execution, resources on streamlining production operations provide actionable guidance on reducing waste and improving flow. If you want a broader view of available digital solutions, reviewing the top manufacturing software types helps you map tools to your specific operational challenges. Mestric™ offers an onsite demonstration to show how connected machinery and real-time KPI tracking work in practice across your production environment.
OEE tracks equipment effectiveness by combining availability, performance, and quality into a single score. Pair it with first-pass yield, cycle time, and downtime rates, each with clear targets and daily review routines, for a complete view.
Poor change management, disconnected goals, and failure to embed new routines alongside technology are the primary causes. Research confirms that only 8% of initiatives achieve all their targeted results, even when digital tools are widely adopted.
Teams need daily routines, visible KPIs, and management discipline to convert data into action. Structuring management routines and automating KPI collection, while pairing leading and lagging indicators, enables frontline teams to respond in real time rather than reacting after the fact.
Governance creates accountability by embedding routines and clarifying decision rights at every level. Streamlining governance, including reducing unnecessary meetings, directly frees leadership capacity for high-impact improvement activities.
Quantify improvement potential using baseline benchmarks such as OEE and first-pass yield, then map ROI scenarios against your identified loss categories. Assessing current processes and designing a coherent implementation roadmap demonstrates credible links between investment and strategic business outcomes.


