

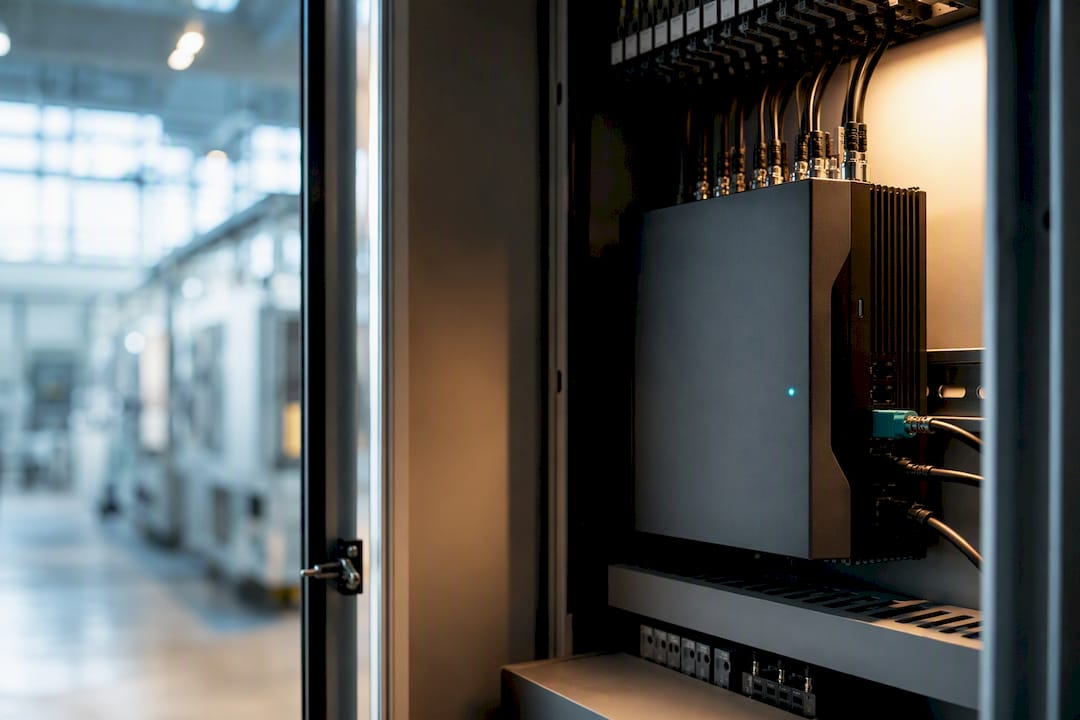
MQTT is a suitable, lightweight messaging protocol for production environments, and it works best when paired with an edge gateway, a broker and a proper MES integration. It gives you scalable, bi-directional data flow between machines and software without heavy network overhead. The practical next step is not a factory-wide rollout: pilot one machine with a single gateway and broker, prove the data flow, then scale.
TL;DR:
- Local brokers near machines maintain low latency for real-time control and monitoring, while central brokers support enterprise analytics and reporting.
- Piloting on inexpensive hardware like Raspberry Pi, then upgrading to industrial-grade devices, typically costs around US$1,000 per machine at scale, depending on wiring and existing assets.
- Securing MQTT involves enabling TLS, using certificate-based authentication, and implementing topic-level access controls to prevent security vulnerabilities.
- Proper topic hierarchy, QoS settings, and a phased pilot are essential to avoid operational failures and excessive bandwidth use in large-scale deployments.
- Integrating MQTT with legacy protocols like Modbus or OPC UA requires careful translation layers, which should be well-documented to prevent long-term maintenance issues.
MQTT works on a publish/subscribe model. A machine (or its gateway) publishes a message to a topic on a broker; anything subscribed to that topic receives it instantly, with no direct connection between sender and receiver. That decoupling is precisely what makes MQTT v proizvodnji so much easier to manage than the point-to-point integrations that dominate older SCADA setups.
The protocol’s three quality-of-service levels, retained messages and persistent sessions matter more on a factory floor than they might elsewhere. QoS 0 fires and forgets, QoS 1 guarantees delivery but allows duplicates, and QoS 2 guarantees exactly one delivery, at the cost of extra handshaking. MQTT 5 adds richer error reporting and message expiry over MQTT 3.1.1, and the protocol carries ISO 20922 standard status, which matters when procurement teams ask whether a technology is vendor-locked or genuinely open.
Why manufacturers keep choosing it:
Where you put the broker decides how the whole system behaves. A local broker sitting close to the machines keeps HMI and SCADA response times fast, because messages never leave the plant network. A central or cloud broker, by contrast, is built for enterprise reporting and cross-site analytics, where a few hundred milliseconds of latency is irrelevant.
Most production deployments end up combining both, structured roughly like this:
plant/line1/machine3/telemetry means the same thing on every site.Many plants run MQTT alongside OPC UA rather than instead of it. MQTT handles lightweight telemetry transport; OPC UA supplies the richer semantic data model where machines need it.
Skip the enterprise rollout on day one. Every documented success story in industrial MQTT starts narrow and expands only once the basics are proven.
One of the better-documented industrial rollouts, from MTNA’s deployment covered by Automation World, prototyped on a Raspberry Pi before moving to Opto 22 groovRIO devices, and reported an implemented budget of roughly US$1,000 per machine once scaled across sites. That figure is a useful planning anchor rather than a universal quote, since wiring complexity and existing PLC age both move the number.
Strokovni nasvet: Run the pilot on the machine with the worst existing visibility, not the easiest one to wire up. That is where the business case for expansion writes itself.
Before you touch a second machine, confirm the pilot validates naming and QoS conventions you intend to reuse everywhere else. Retrofitting topic structures across twenty machines is far costlier than getting them right on one.
An MQTT broker left open, or protected by a shared password everyone on the floor knows, is not a hypothetical risk. It is one of the most commonly documented misconfigurations in industrial deployments, and it is entirely avoidable.
Strokovni nasvet: Reserve “exactly once” delivery for commands, not high-frequency telemetry. HiveMQ’s own modernisation guidance treats QoS 2 as a complexity cost worth paying only where duplicate delivery would cause real harm.
The value shows up fastest on the shop floor, not in a boardroom slide. Once telemetry flows continuously instead of being logged by hand every hour, the gaps between what happened and what someone recorded start closing.
Faster issue detection is the outcome most engineers notice first. When a spike in vibration or temperature publishes within seconds rather than surfacing on a shift report the next morning, the response window changes from hours to minutes. Explore how real-time monitoring translates into measurable gains once the data pipeline is in place.
Most failed deployments do not fail because MQTT is the wrong protocol. They fail because of avoidable operational choices made under time pressure.
Every one of these is a design decision, not a limitation of the protocol itself, which is why a deliberate pilot phase earns its place in every serious implementation plan.
Most factories are not starting from a clean slate. Modbus, Profibus, and ageing PLCs running proprietary ladder logic are still doing the actual work on the floor, and none of them speak MQTT natively.
The practical answer is an edge gateway that translates. It reads signals from the legacy protocol on one side and republishes them as MQTT topics on the other, without touching the machine’s own control logic. That non-invasive approach matters more than it sounds: I/O tapping rather than code modification keeps production risk low, because nobody is rewriting logic on a PLC that has run unattended for fifteen years.
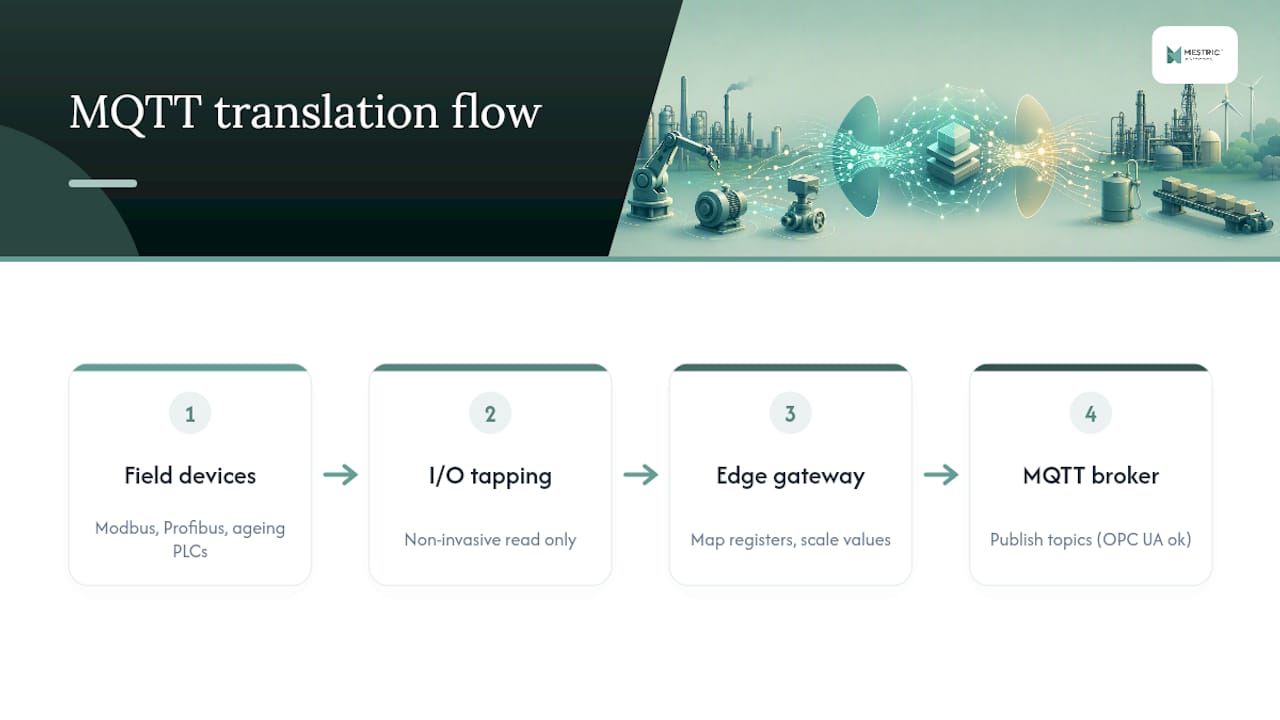
Where the equipment already speaks OPC UA, the gateway’s job is simpler: OPC UA servers can often publish directly into an MQTT broker, giving you the semantic richness of OPC UA’s data model alongside MQTT’s lightweight transport. Where the equipment only speaks Modbus, expect to map registers manually to topic names, which is tedious but predictable work.
The mistake worth avoiding is treating protocol translation as a one-off script. Document every mapping (register, topic, unit, scaling factor) as you build it, because the person maintaining the system in three years will not have written it, and Modbus register maps are notoriously opaque without notes. A digital manufacturing primer is worth reading if your engineering team is weighing how far to modernise before touching legacy assets versus running a translation layer indefinitely. In practice, most plants run the translation layer far longer than planned, simply because replacing working legacy hardware rarely clears the cost-benefit bar.
A single machine publishing telemetry every second generates more data in a week than most manual logging systems produced in a year. Deciding what to keep, and where, matters as much as getting the messages flowing in the first place.
Raw MQTT payloads are not a database. The broker’s job is transport, not storage, so every serious deployment routes messages into a persistence layer immediately after they arrive. Time-series databases are the common choice for telemetry, since they are built to handle high-frequency writes and time-based queries efficiently, unlike a general-purpose relational database asked to do the same job.
A sensible structure separates data by purpose rather than dumping everything into one table:
Retention policy deserves a deliberate decision, not a default. Keeping every raw QoS 0 message forever is rarely worth the storage cost when a downsampled or aggregated version serves reporting needs just as well. What should never be downsampled is anything feeding a quality or safety record, where the original resolution may be needed later. Mapping how collected data feeds decision-making before you finalise a storage strategy avoids rebuilding it six months in, once someone asks for a report the raw pipeline was never designed to answer.
What works cleanly for five machines can strain badly at fifty. The usual bottleneck is not the protocol itself but the number of open connections, the size and frequency of retained messages, and how many subscribers are pulling from the same busy topics.
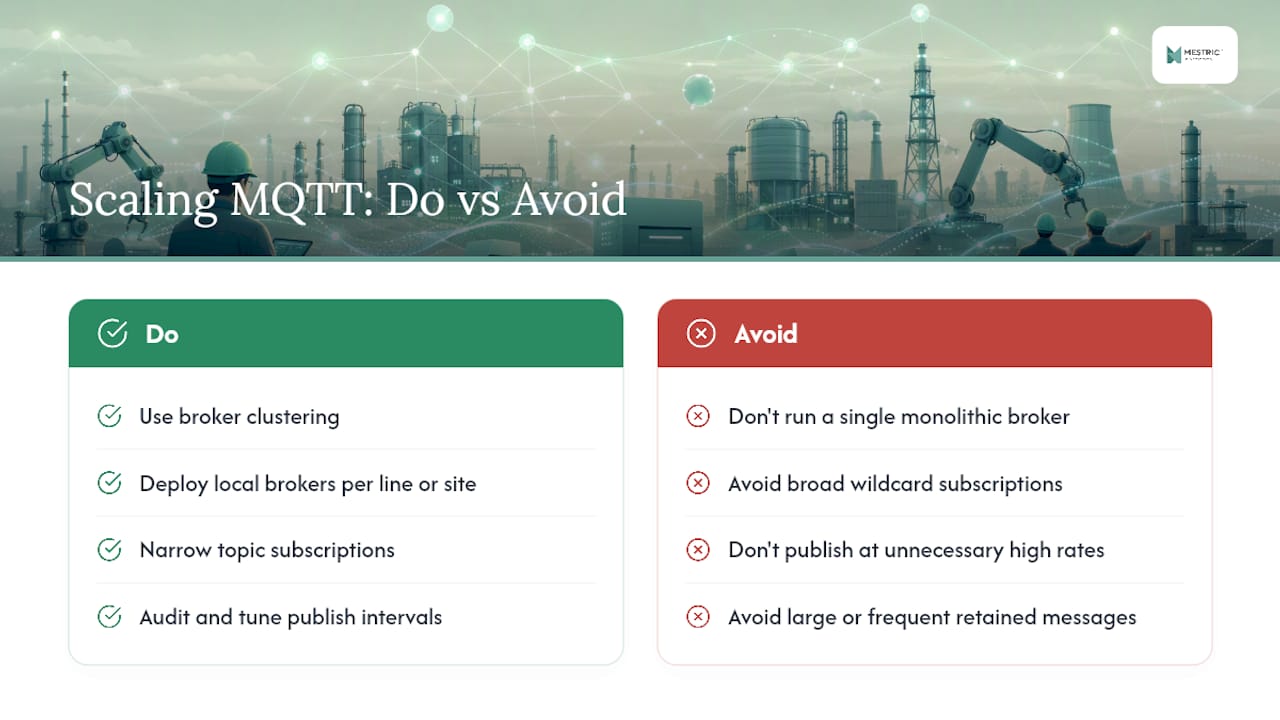
Broker clustering is the standard answer. Rather than one broker handling every connection, a cluster distributes load across nodes and keeps the system running if one node drops, a pattern HiveMQ documents in detail for enterprise-scale unified namespace deployments. Local brokers per line or per site, bridged upward to a central cluster, tend to outperform a single monolithic broker serving the whole plant, because local traffic never has to leave the local network to reach its first subscriber.
Topic design becomes a performance question at scale, not just an organisational one. Wildcard subscriptions across an entire plant’s namespace look convenient during development, but they become expensive once hundreds of machines are publishing simultaneously, since every subscriber processes every matching message whether it needs it or not. Narrowing subscriptions to what a given dashboard or system genuinely consumes keeps broker load predictable as machine count grows.
Message frequency is worth auditing before it becomes a problem. A sensor publishing every 100 milliseconds because that was the default, rather than because anything downstream needs that resolution, is a common and avoidable source of unnecessary broker load. Tuning publish intervals to match what the consuming system actually uses, rather than what the sensor is technically capable of, is one of the cheapest scalability wins available.
Raw MQTT messages are not insight. Somewhere between the broker and the person making a decision, that data needs to become a chart, an alert, or a trend line someone can act on.
Time-series visualisation platforms are the common layer directly above the broker, built to query high-frequency data and render it as live dashboards without the lag of a traditional business intelligence tool. Above that sits the analytics layer, where telemetry gets combined with quality and downtime records to answer questions no single machine’s data stream could answer alone, such as which shift, which operator pattern, or which upstream process correlates with a defect spike.
For predictive maintenance, the same MQTT streams that feed a dashboard can feed a machine learning model, since brokers are well placed to route data into both destinations simultaneously without duplicating the connection to the machine itself. The practical choice most plants face is not whether to build custom visualisation, but whether to connect MQTT into a platform that already understands manufacturing KPIs, rather than building OEE and downtime logic from scratch on top of a generic charting tool. That is precisely the layer where an MES earns its place in the stack, turning a topic full of numbers into a metric a production manager actually uses.
The flow is straightforward: a machine publishes to its edge gateway, the gateway forwards to a broker, and an MES subscribes to the relevant topics to build live KPIs. That is the practical route from raw telemetry to a dashboard a production manager actually checks.
The system takes that subscribed data and turns it into downtime analysis, quality monitoring and cost tracking without a separate reporting layer bolted on afterwards. Instead of a spreadsheet reconciled at shift end, the KPI updates as the machine publishes. An on-site demonstration shows how connected machinery feeds these dashboards in a live production setting, which is worth seeing before committing to any particular MQTT architecture.
— Andraž
This is a practical route from a working MQTT pilot to an MES that plant managers actually use, without building custom dashboards on top of raw broker topics yourself. Where a DIY stack leaves you assembling visualisation, quality logic and downtime reporting from separate tools, a suitable MES subscribes directly to machine topics and turns them into KPIs, cost analysis and quality alerts your team can act on the same shift.

If your pilot machine is already publishing telemetry, the next step is straightforward: connect that feed to a system built for production KPIs rather than generic charts. See how MES compares to traditional manufacturing tracking and request an on-site demonstration to see your own machine data rendered as live dashboards before deciding how far to scale.


 069 763 552