

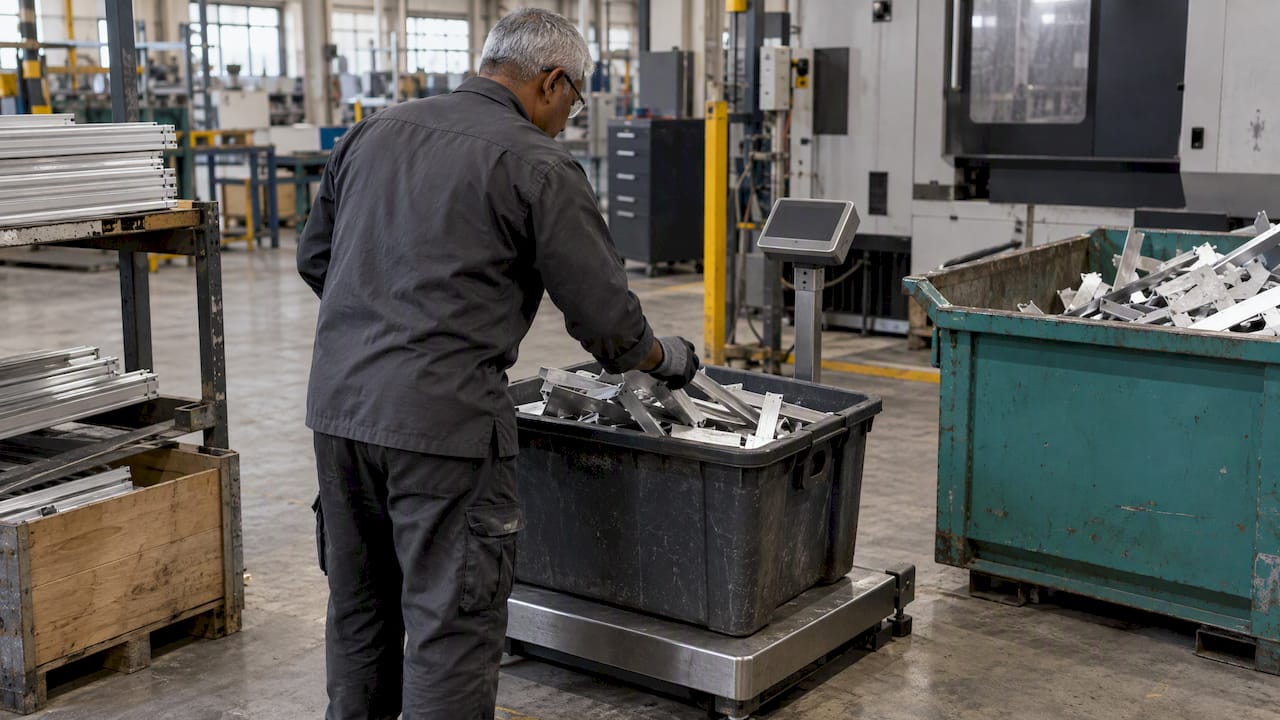
Tracking material consumption means knowing, for every production order, how much material went in, how much came back, how much became product and how much was lost. You get there by recording issues, returns, scrap and rework in consistent units, comparing them with the planned bill of materials, and reconciling the result with inventory. This guide shows you what to record, which metrics to watch, how to collect the data and how to start in a Slovenian plant.
In practice it is a ledger of material flows. You record what enters a process, what moves through it and what leaves it, as product, scrap or waste. ISO 14051:2011 describes material-flow cost accounting in these terms: tracing and quantifying material flows and stocks in physical units, then evaluating the costs linked to those flows. The standard applies to any organisation that uses materials and energy, whatever its size or sector.
Why does it matter? The same standard says this kind of tracking improves transparency and supports financial and environmental decisions, helping organisations reduce material use, losses and related costs. The Asian Productivity Organization’s manual on material-flow cost accounting adds a point many finance teams recognise: tracking reveals the physical and monetary cost of output and of losses such as waste, emissions and wastewater, costs that conventional accounting often fails to expose.
For a plant manager this translates into simple questions. Why did order 4812 use 6% more aluminium than the routing says? Which shift scraps the most? Is the stock count wrong, or is the machine?
A production order is the natural unit of tracking. Every movement of material should be tied to an order number, a material code and, where it matters, a batch or lot number. Five quantities cover most plants:
| Quantity | What it means | Typical source |
|---|---|---|
| Issued | Material released from the warehouse to the line | Warehouse transaction, barcode scan |
| Returned | Unused material sent back to stock | Return transaction, weighing |
| Consumed | Material actually used in good and bad output | Machine counters, scales, backflush |
| Scrapped | Material lost in rejected parts, start-up and changeover | Operator entry, quality station |
| Reworked | Material in parts sent back for repair or reprocessing | Quality station, rework order |
The basic balance is simple: issued minus returned should equal good output plus scrap plus the remainder still in process. If it does not, you have a gap to investigate.
Most errors start with mixed units: kilograms in the warehouse, metres on the line, pieces in the ERP. ISO 14051 recommends consistent physical units, preferably mass, so that inputs and outputs can be balanced. If your material is bought by length or sheet, define a fixed conversion per material code and keep it under change control.
The same standard recommends attributing the costs of material losses to those losses rather than to the products. This matters in reporting. If scrap cost disappears into the unit cost of good parts, nobody sees it. Give scrap its own line, with its own cause code, and it becomes something a team can reduce.
Once you record the movements, comparison is straightforward. You need a planned figure (from the bill of materials and routing, including an agreed allowance) and an actual figure from the shop floor.
A worked example. An order plans 1,000 kg of steel strip at an agreed 3% allowance, so 1,030 kg is the ceiling. The warehouse issues 1,100 kg, 40 kg is returned, and 1,000 kg of good parts leave the line. That leaves 60 kg unaccounted for beyond the good output. If the scrap records show 35 kg, 25 kg is still missing. That gap is a measurement or booking problem, and it is worth finding before you blame the operators.
Metrics only help if everyone calculates them the same way. Practitioners working with ISO 22400 KPIs stress that work centres, products and equipment need consistent identifiers across MES, ERP and SCADA, and that calculation logic should be version-controlled. The principle is sound even in a small plant: write down each formula, give it an owner, and change it deliberately, not in a spreadsheet cell.
The right method depends on the material, the speed of the line and how much accuracy the decision needs. Most plants use a mix.
Timeliness matters as much as accuracy. A variance you learn about at month end is an accounting entry. A variance you see within the shift is a chance to stop the problem.
Consumption records and inventory records describe the same material from two sides, and they must agree. Three habits keep them together.
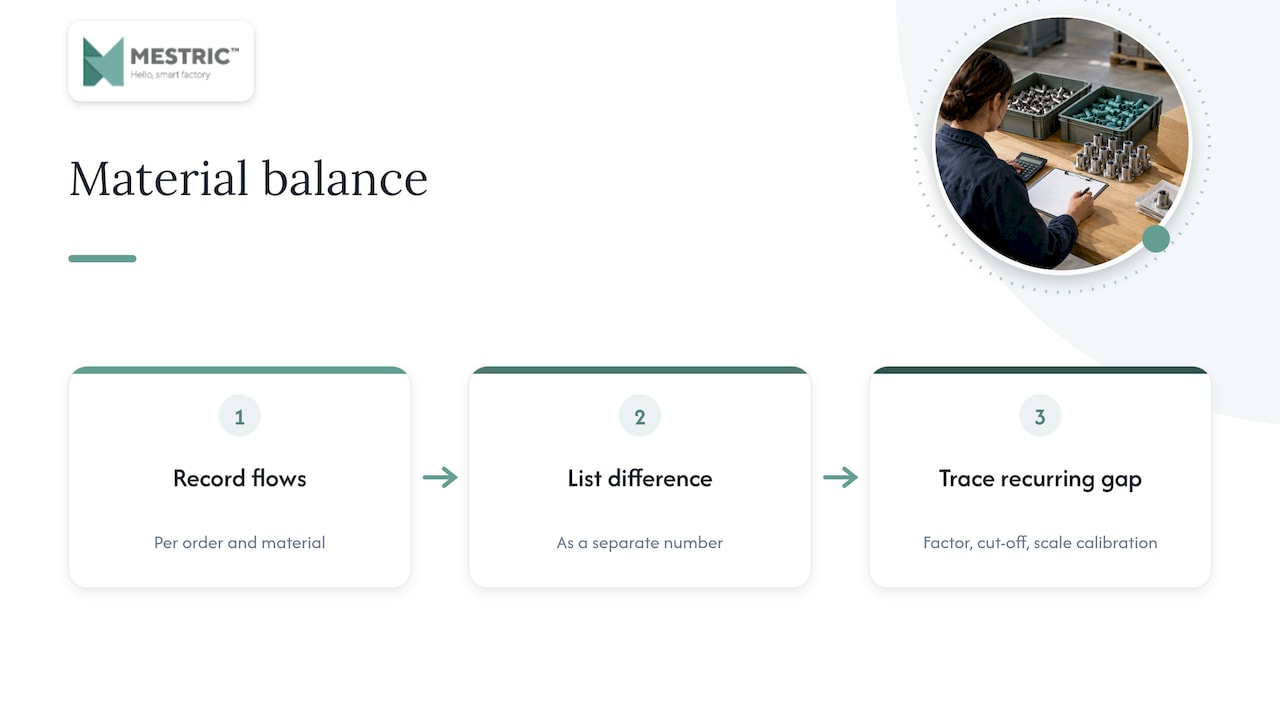
ISO 14051 recommends balancing input and output flows so that significant data gaps show up. Do this per order and per material, and list the difference as its own number. A recurring gap of the same size usually points to a systematic cause: a wrong conversion factor, an unrecorded cut-off, a scale that needs calibrating.
Automated figures are not automatically right. Check that part counts from the PLC reconcile with the inventory movements posted in the ERP, and compare machine-reported quantities with a physical count at agreed intervals. Practitioners recommend this layered validation because it exposes configuration errors that would otherwise sit unnoticed inside reported OEE and yield data. The three-phase logic used in steel fabrication quality control, checking before, during and after the process, is a useful pattern to borrow for material records too.
We see the same pattern in many plants. They already collect plenty of data, but it sits in separate places: counters on machines, quantities in the ERP, scrap notes on paper. The problem is rarely a lack of numbers. It is that nobody can see them together, against the order, in time to act.

That is why we built Mestric around direct connection to equipment and automated data capture. When the machine reports what it produced and what it rejected, and the order shows what was issued, the variance appears without anyone retyping a figure. Operators spend less time on manual entries, and managers see bottlenecks and quality deviations while there is still something to do about them.
Our advice is to resist the urge to track everything on day one. Pick the one material that costs you the most, the one line where scrap is highest, and make the balance close there. When the numbers are trusted, the rest of the plant follows, because people copy what works.
— Andraž
Data only pays back when it changes something. The APO manual describes the approach as identifying material losses, assigning their costs and finding improvements that reduce waste, material inputs and costs. In daily work that looks like this:
For related reading, see our guides on production quality monitoring KPIs and on automating monitoring and tracking real-time KPIs.
Material tracking and waste records meet at the point where material leaves your process as waste. In Slovenia, waste generators and holders must provide an evidence document, the evidenčni list, for every waste shipment, confirming transfer and receipt as the waste moves from its origin to storage or treatment. The official GOV.SI overview of waste categories notes that waste from production and service activities makes up the majority of all waste, which is a reminder that a manufacturer’s scrap data is also environmental data.
If your scrap is recorded by weight and cause per order, you already hold most of the figures needed to prepare those documents consistently. Confirm the exact obligations for your waste types with the official pages and your environmental officer, because requirements depend on the waste and the activity.
If you are still deciding how an MES relates to your ERP, our comparison of MES and traditional manufacturing and the overview of ERP in the software landscape explain the division of roles.
Mestric™ is an easy-to-use MES that connects directly to your machines, collects production data automatically and shows KPIs such as performance, downtime, quality parameters and cost analysis on live dashboards. AI-powered tools help you identify bottlenecks and optimise process norms, with fewer manual errors along the way.
You can see it working on connected machinery in a real production environment through an onsite presentation at our demo centre. Explore the Mestric™ MES solution or ask for a demonstration for your own materials and lines.
Consumption is the total quantity of material used by an order, including what ended up in scrap. Usage variance is the difference between that actual quantity and the planned quantity from the bill of materials. Consumption tells you how much was used; variance tells you whether it was more or less than it should have been.
Yes. Barcode scanning, scales and a well-kept spreadsheet or ERP module can give you issued, returned and scrapped quantities per order. The limits are delay and manual errors, and you will find it hard to see variance during the shift. An MES removes much of the retyping by collecting the data from machines directly.
Check per order at closing, and run cycle counts on high-value materials on a regular schedule, for example weekly or monthly depending on value and turnover. Compare automated machine counts with physical counts during the first weeks of any new setup. After that, a periodic spot check is enough to catch drift.
Mass is usually the best common unit because it allows inputs and outputs to be balanced, which is what ISO 14051 recommends. Where you buy or use material by length, area or pieces, define a fixed conversion per material code. Keep that conversion in master data so all systems use it.


 069 763 552