


The fastest way to raise equipment utilisation is to measure it accurately, classify assets by role, switch to usage-based maintenance, tighten scheduling around real availability, and reallocate idle machinery before you buy anything new. None of these steps require capital spend to start. They require data discipline.
This guide draws on established frameworks including OEE, ISO 50001 energy management principles, and DOE motor-management guidance to give you a working method, not just theory.
Start with these six moves:
Profi tipp: Run a 30-day utilisation audit on one critical asset category before rolling out anything fleet-wide. You will find your quick wins faster than any full-scale system rollout would.
Raising equipment utilisation depends on accurate per-asset measurement, usage-based maintenance, and scheduling built around real availability rather than assumed capacity.
| Pont | Részletek |
|---|---|
| Measure per asset, not fleet-wide | Calculate utilisation as run hours ÷ available hours for each machine, then track distribution, not just averages. |
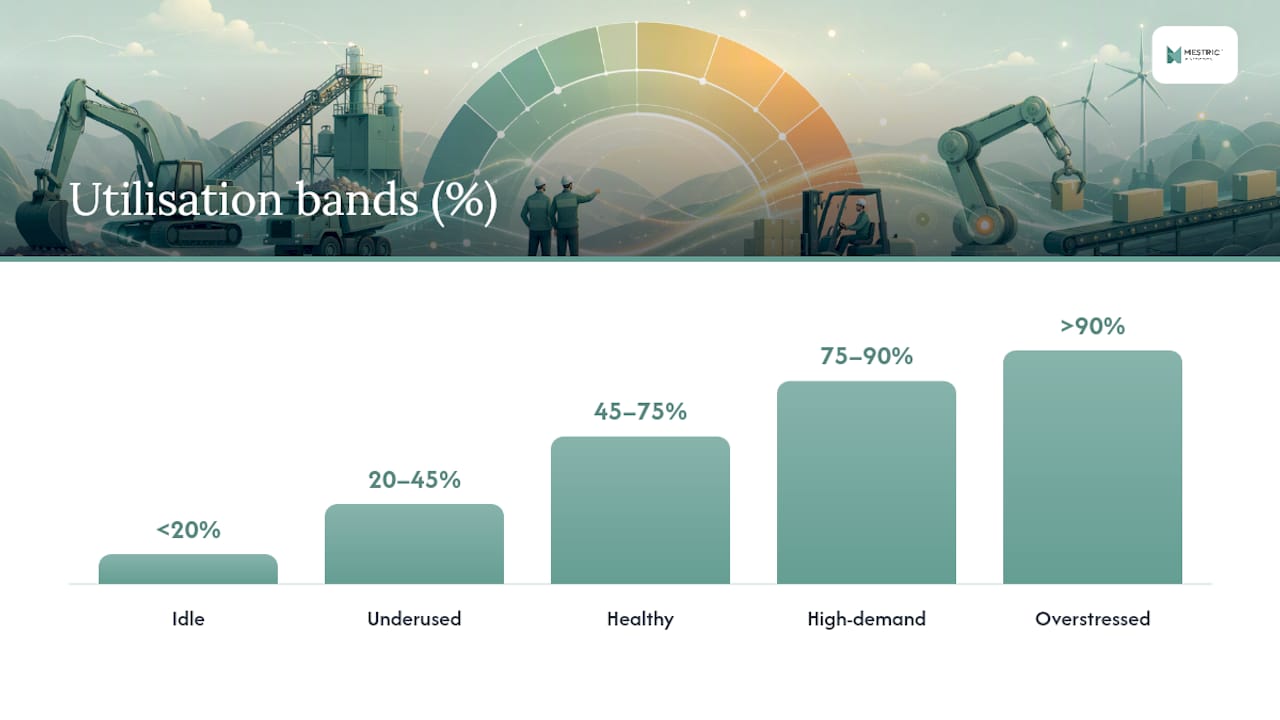
| Classify into five utilisation bands | Sort assets into idle, underused, healthy, high-demand and overstressed to guide reassignment decisions. |
| Shift to usage-based maintenance | Schedule servicing by hours or load rather than calendar dates to avoid over- and under-servicing. |
| Close the idle-time gap with SOPs | Standardise handover, pre-start checks and operator fault logging to improve both uptime and data quality. |
| Automate the data loop with an MES | Mestric connects shop floor equipment to real-time dashboards, pairing utilisation with downtime and quality metrics. |
Chasing 100% utilisation is a mistake most operations teams make once and regret. Machines running flat out with no buffer break down harder and more often, and they leave zero slack for changeovers, urgent jobs or maintenance windows. The sweet spot for most fixed assets generally falls within a moderate to high utilisation range, balancing availability and maintenance needs.
A practical way to work this out is to sort every asset into five bands:
Practitioner audits of asset fleets commonly find that 15% to 25% of assets sit in the idle band at any given time. That is not a rounding error. It is capital sitting unused while you might be leasing or buying more of the same equipment elsewhere in the business.
Prioritise action using five criteria: revenue impact if the asset fails, criticality to production flow, replacement cost, safety or regulatory exposure, and seasonal demand swings. Build a simple table with asset class, target utilisation band, and a decision rule (“below 20% for 60 days = reassign or sell”). Review the pilot after 30 days, run a strategic review quarterly, and fold utilisation data into annual capital planning. Where energy-intensive equipment is involved, ISO 50001’s continuous-improvement cycle gives you a ready-made structure for tracking both utilisation and energy performance together.
You cannot manage what you cannot see, and most manufacturers underestimate how scattered their asset data really is until they try to consolidate it. A central register should record, at minimum: asset ID, current location, cumulative hours, responsible owner, maintenance history, spare-parts stock level, and the target utilisation band you set above.
Tagging method depends on asset value and fleet size:
Booking rules matter as much as tagging. Shared assets need a reservation system with clear short-term pool rules, so two shifts do not double-book the same forklift. Spare-parts policy should tie stock levels to criticality: critical assets carry a minimum spares buffer defined by mean time between failure, while low-risk equipment can run leaner.
For a 30-day pilot, prioritise these steps:
Profi tipp: Start your pilot with the equipment category that has the loudest complaints from operators. It gives you a built-in audience for the results, and buy-in for phase two.
Calendar-based maintenance schedules equipment servicing by date regardless of actual use, and it wastes labour on machines that barely ran while under-servicing ones running flat out. Usage-based maintenance schedules by hours or load instead, matching intervention to real wear.
Three strategies apply depending on asset criticality and failure cost:
Research into multimodal prognostics, which combines sensor readings, imaging and text-based fault logs, shows this fused approach can shorten repair time and cut non-productive standby more effectively than sensor data alone.
Track these KPIs to know whether your maintenance strategy is working:
Build a maintenance policy checklist covering data inputs (sensor feeds, operator logs), alert thresholds per asset class, named roles for each alert tier, and an escalation rule for missed responses.
Idle time rarely comes from broken machines. It comes from queues, handovers and operators who were never told what to do when a fault light comes on. Aligning production schedules with actual asset availability, rather than theoretical capacity, closes most of that gap on its own.
Operator training should cover three things: safe operation basics, first-line fault diagnosis, and a feedback loop so operators can log the real cause of downtime rather than a generic “machine stopped” entry. That feedback loop is where most utilisation programmes quietly fail. Without it, you get clean dashboards full of meaningless data.
A workable handover SOP includes:
To drive adoption, appoint shift-level champions rather than relying on a single manager to push change. Run short training sprints, ten to fifteen minutes, rather than one long session nobody retains. Measure behavioural KPIs like SOP completion rate alongside the utilisation numbers, because a spike in utilisation with no change in SOP compliance usually means someone is gaming the data. Production scheduling that accounts for real asset windows, not assumed ones, is the single biggest lever most teams have never pulled.
Profi tipp: Ask operators what causes their idle time before you tell them what you think it is. The two answers rarely match, and theirs is usually more accurate.
Utilisation is actual run hours divided by available hours, expressed as a percentage. Availability, one of the three components of OEE, is calculated as (available time minus downtime) divided by available time. OEE itself multiplies availability by performance by quality, giving you a single figure for how effectively a machine converts scheduled time into good output.
Here is a worked example for one eight-hour shift on a single machine:
Data sources vary in accuracy. Telematics and IoT sensors give continuous, high-accuracy readings but cost more to deploy. QR scans and operator logs are cheap but depend on human consistency. Computer vision systems can track active versus idle time on mobile assets without retrofitting telematics hardware, which makes it a useful bridge option for fleets where sensor installation is impractical.
Build dashboards that show distribution, not just averages. An average utilisation of 70% across ten machines can hide two overstressed assets and three sitting idle. Review weekly for operational decisions, monthly for KPI trend analysis.
Raw utilisation numbers sitting in a spreadsheet do not fix anything. The value comes from connecting that data to a decision loop: sensor reads a status change, an MES or EAM platform ingests it, a dashboard flags the pattern, and that triggers either a dispatch rule or a maintenance ticket automatically.
A typical workflow looks like this: sensor detects idle state beyond threshold → system logs it against the asset record → dashboard surfaces the pattern to the shift supervisor → dispatch rule reallocates the asset or a maintenance ticket opens if the idle state correlates with a fault code.
Start small. Pick one production line or one asset type, and integrate a single data feed before expanding. Trying to connect every machine on day one is the most common reason these pilots stall.
Manufacturers that pair real-time monitoring with automated KPI tracking catch bottlenecks days or weeks before they would surface in a monthly report, because the dashboard flags the deviation as it happens rather than after the shift ends.
Mestric connects directly to shop floor equipment to supply exactly this kind of real-time performance tracking, pairing utilisation data with downtime and quality metrics on one dashboard.
Profi tipp: Pilot the integration on the asset category with the most downtime complaints. That is where the dashboard will earn its keep fastest, and where sceptics turn into advocates.
Treat this as a phased rollout, not a single project.
Prioritise in this order:
Set acceptance criteria per phase, for example “idle band reduced by half before scaling to line two.” On budget, spend first on data collection and one clean integration rather than a fleet-wide platform rollout. That is the highest-ROI first move most teams can make, and it keeps early spend in the operating budget rather than a large capital outlay.
Profi tipp: Track downtime causes against your finance team’s cost categories from day one. It makes the ROI conversation with leadership far easier later. You can see how downtime tracking connects to financial reporting in more detail if that handover is new to your team.
I’ve watched utilisation programmes succeed and stall in equal measure, and the difference is never the software. It’s whether operators trust the data enough to act on it daily. Get that right, and the ROI shows up within a quarter.
Mestric gives you the connected layer that turns the manual audit work in this guide into an ongoing discipline, without the spreadsheet reconciliation that usually kills these programmes after month two. Once your 30 to 90 day pilot shows where the idle time and maintenance gaps actually sit, a platform earns its place by automating what you were tracking by hand: real-time performance tracking, automated data collection from connected equipment, downtime analysis, and KPI dashboards that combine utilisation with quality and cost data on one screen.
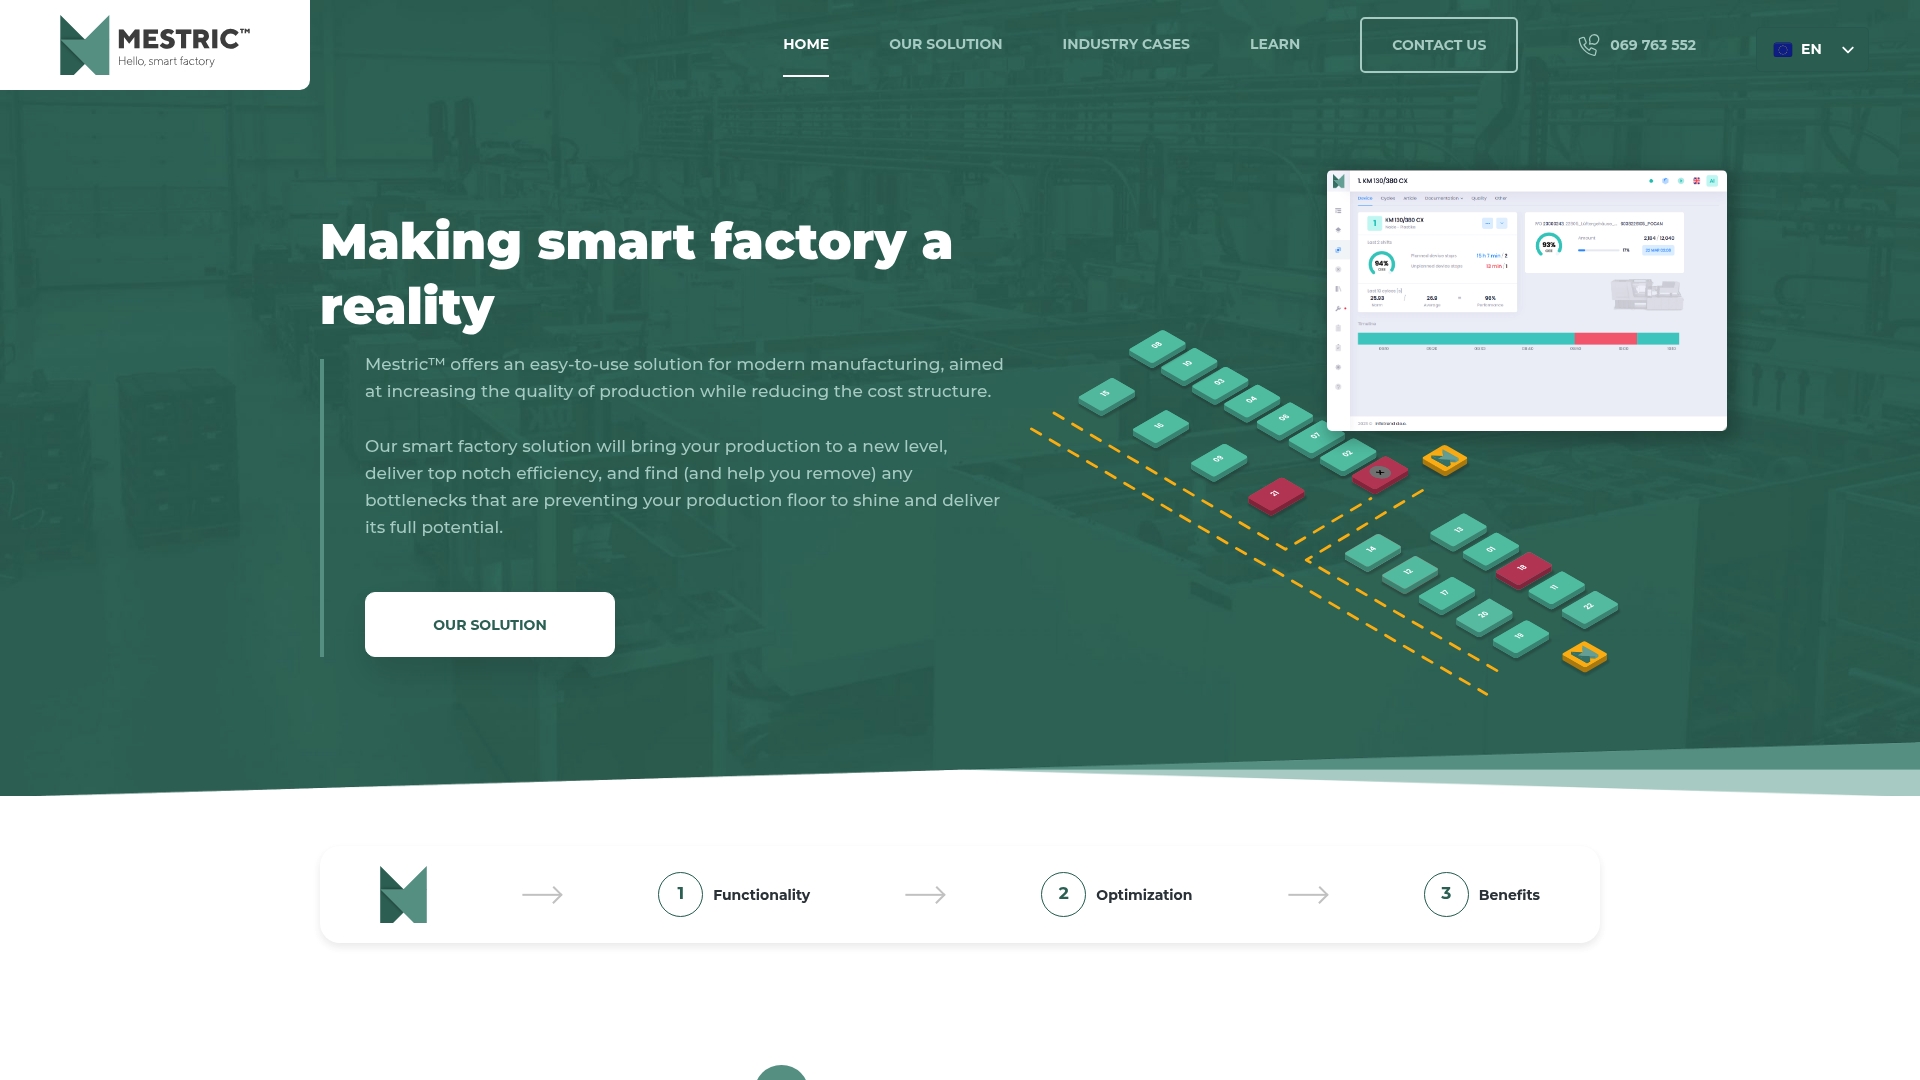
Consider a platform once manual tracking starts limiting how many lines or asset categories you can monitor at once. That is usually the point where spreadsheets stop scaling and dispatch decisions start lagging behind the data. Mestric’s real-time production tracking connects directly to shop floor equipment, and the team can walk you through an onsite demonstration tailored to your specific asset categories and current data gaps. Book a demo to see how the dashboards map to the audit you have already started.
What is a good equipment utilization rate?
Most fixed assets perform best between 65% and 85% utilisation. Above 90% sustained, failure risk rises sharply; below 45%, the asset is likely a candidate for reassignment.
How do you calculate equipment utilization?
Divide actual run hours by total available hours for the period, then multiply by 100. Measure this per asset, since fleet-wide averages hide both idle and overstressed machines.
What is the difference between utilization and OEE?
Utilisation measures how much of the available time an asset actually ran. OEE goes further, multiplying availability by performance and quality to show how much of that run time produced good output at full speed.
How often should equipment maintenance schedules be reviewed?
Review usage-based maintenance triggers monthly for critical assets and quarterly for lower-criticality equipment, adjusting thresholds as usage patterns and failure data accumulate.
What causes low equipment utilization?
Common causes include poor scheduling that leaves assets waiting between jobs, inadequate operator training on fault handling, unclear booking rules for shared equipment, and calendar-based maintenance that takes machines offline unnecessarily.


 069 763 552