


An Andon system is a visual and audible shop-floor signalling system that makes problems visible the moment they occur, cutting unplanned downtime by accelerating response. It flags machine faults, material shortages and quality issues in real time, alerting whoever needs to act. Modern digital Andon setups go further, feeding every event straight into an MES or dashboard so the data drives lasting improvement, not just a faster fix.
TL;DR:
- Digital Andon systems with dashboards and mobile alerts shorten response times and reduce unplanned downtime more effectively than traditional hardware setups.
- Integrating Andon with MES enables automatic OEE calculation, root-cause analysis, and cross-line data sharing, improving continuous improvement efforts.
- Successful implementation relies on clear escalation rules, operator buy-in, disciplined data review, and starting with pilot lines to refine the process before scaling.
- Operator-initiated calls tend to yield faster improvements than automated sensor triggers, emphasizing the importance of manual signaling for immediate alerts.
- Quick deployment is possible using cloud-based platforms, but ongoing governance and review habits are essential for maximizing long-term value from Andon data.
The concept traces back to the Toyota Production System, where it became one of the cornerstones of visual management on the shop floor. Toyota’s engineers wanted a way for any worker to stop the line and flag a problem without waiting for a supervisor to notice. That principle, giving operators the authority to surface issues immediately, is still what separates an effective Andon Sistem from a basic warning light.
At its core, Andon is a signalling method: a light, sound, or on-screen alert that tells the right person something has gone wrong. The usual triggers are:
You’ll find Andon working best on lines with tight sequencing, where a single stoppage ripples through several stations, and in operations where quality escapes are expensive to fix downstream.
Every Andon event follows a similar pattern, whether it runs on a pull-cord or a mobile app. Understanding that flow helps you design sensible escalation rules rather than bolting alerts onto a process that was never mapped out.
Profi tipp: Set your response SLA by station criticality, not a blanket rule. A bottleneck machine needs a two-minute response; a non-critical rework station can tolerate ten.
Vendors running digital Andon deployments report that integrating alarms with dashboards, mobile alerts, and configurable escalation shortens response times measurably compared with a board that nobody watches remotely.
Choosing hardware over software, or a mix of both, usually comes down to connectivity, workforce habits, and how much you need from the data afterwards.
Connectivity, workforce size, and how seriously you plan to mine the data should decide which route you take.
Response time and unplanned downtime are the two metrics that move fastest once Andon is running properly, and they cascade into Overall Equipment Effectiveness (OEE) through the availability component, as described in this Engineer’s Guide to Design for Manufacturability. A faster call-to-response cycle means fewer minutes lost per stoppage, which lifts availability without touching performance or quality rates at all.
Track these from day one:
Vendor case studies on Andon-driven downtime reduction describe measurable drops in unplanned downtime within weeks of going live, though the scale of improvement depends heavily on how disciplined the escalation and logging habits are. Set a modest first target, perhaps a 10 to 15% cut in average response time over the first quarter, and look for low-hanging fruit on your worst-performing station rather than rolling out everywhere at once. Our guide to real-time monitoring benefits covers how these gains compound once visibility extends beyond a single line.
An Andon call on its own tells you a line stopped. An Andon call linked to your MES tells you why, how often, and what it’s costing you. That distinction is where digital Andon earns its budget line.
Integration typically enables:
The usual technical routes are PLC or OPC-UA connections for machine-level triggers, APIs for pushing data into the MES, and MQTT for lightweight sensor messaging across a wider plant network. Andon integrated with an MES can automate OEE tracking and structure the fault data for genuine root-cause work rather than guesswork.
Profi tipp: Require a one-line cause code on every Andon call before it closes. That single habit turns a stoppage log into a Kaizen backlog, and it’s the difference between fixing the same fault ten times and fixing it once.
Those tagged records are what feed a proper PDCA cycle: plan a countermeasure, run it, check the repeat-incident rate, and act on what the data shows.
A pilot beats a plant-wide rollout every time, because it lets you fix your escalation logic before it’s baked into every line. Work through this sequence:
Profi tipp: Rollouts on cloud-based digital Andon platforms can go live in days rather than months, so don’t let planning drag past your pilot’s usefulness.
Most Andon failures aren’t technical. They’re habits that quietly stop the system earning its keep.
Avoid these:
Instead, require a brief cause note on every call, set explicit SLAs per station, and treat the operator’s call as the start of a Kaizen conversation, not a complaint. Andon logs earning their keep depend on governance and a regular review cadence; without that discipline, the data sits unused no matter how good the hardware is.
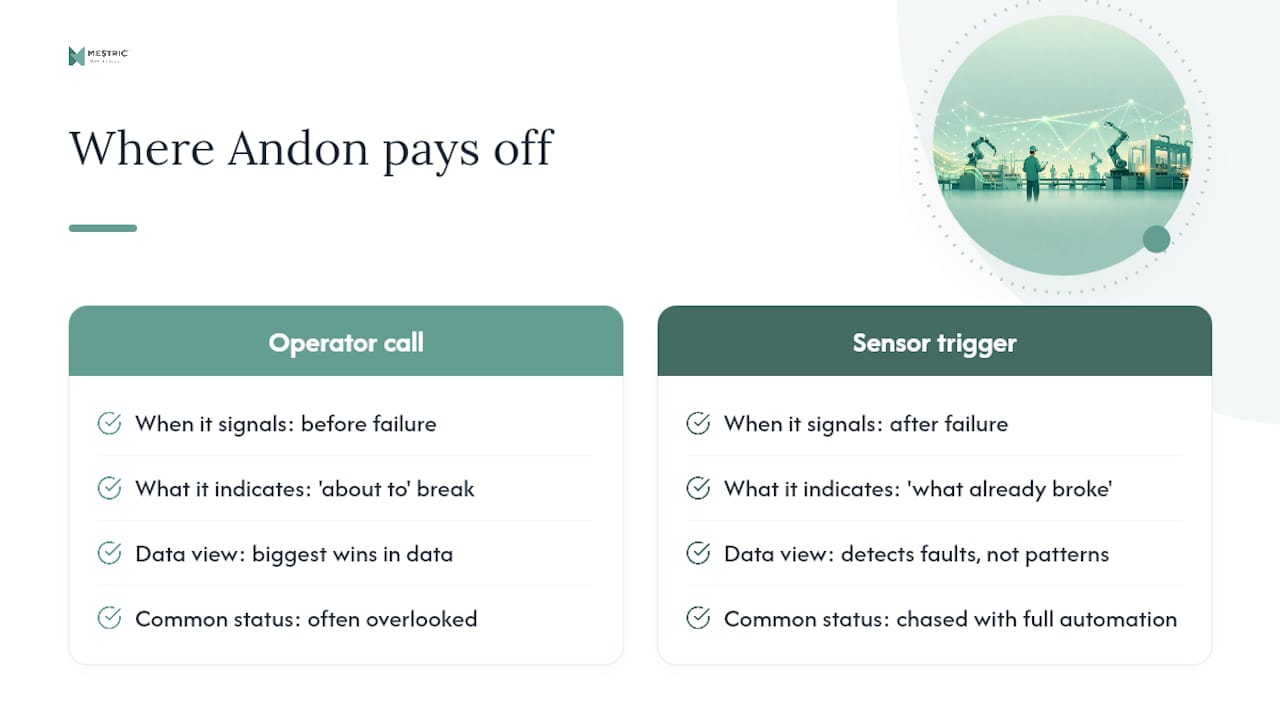
The biggest wins I’ve seen argued for in the data come from operator-initiated calls, not automated sensor triggers. A machine fault sensor tells you what already broke; an operator pulling a cord tells you something is about to. That’s the quicker win most plants overlook while chasing full automation.
Andon is a signalling layer, not a fix. It surfaces the problem and starts the clock, but the corrective action still comes from a team willing to act on the pattern in the logs, standard Kaizen and PDCA territory, not the Andon board itself. Skip that step and you’ve bought an expensive doorbell.
— Andraž
Andon tells you something went wrong. An MES tells you why it kept happening and what it’s costing across every line, not just the one with the flashing light. That’s the practical gap Mestric closes for plant managers who want their Andon data to do more than sit in a log file.

Connecting your Andon calls to Mestric’s real-time production monitoring gives you automated OEE calculation pulled straight from downtime events, dashboards that show every line’s status at once, and historic reports that turn last quarter’s repeat incidents into this quarter’s Kaizen priorities. You get quality and cost data sitting alongside your Andon history, so a fault tag isn’t just a timestamp, it’s context for the next decision.
Mestric offers an onsite demonstration so you can see connected machinery and live Andon data on your own shop floor before committing to anything. If you’re piloting Andon or scaling an existing setup, get in touch to arrange a demo of Mestric’s MES platform and talk through what integration would look like on your lines.


 069 763 552